
Our pull request pipeline took 10.5 minutes, and a stronger runner would have saved 1 of them:
Bottom line
A CI/CD pipeline is as slow as its critical path: the longest chain of jobs that wait for each other.
A job that runs in parallel and finishes early costs money and saves nothing.
Our 10.5 minutes: 3.5 waiting on cloud APIs and GitHub itself, 2 downloading packages, 2.6 building a Docker image, 1.7 running browser tests.
More CPU touches the Docker build and part of the tests. About 1 minute.
The 30 to 60 minute outliers that made everyone hate CI were 1 step: apt-get installing 182 packages for a browser from a slow mirror.
The order that works:
- Measure every step on the critical path, with the GitHub API, in seconds
- Remove installs and downloads from that path
- Start every wait (deploys, preview builds) as early as the run allows
- Parallelize tests by sharding, then by cores
- Buy compute last, and buy the persistent disk before the cores
Below is how we did each one, with our numbers. (Yes, I sell DevOps engineers. You can still do this yourself.)
The critical path is the only clock that matters
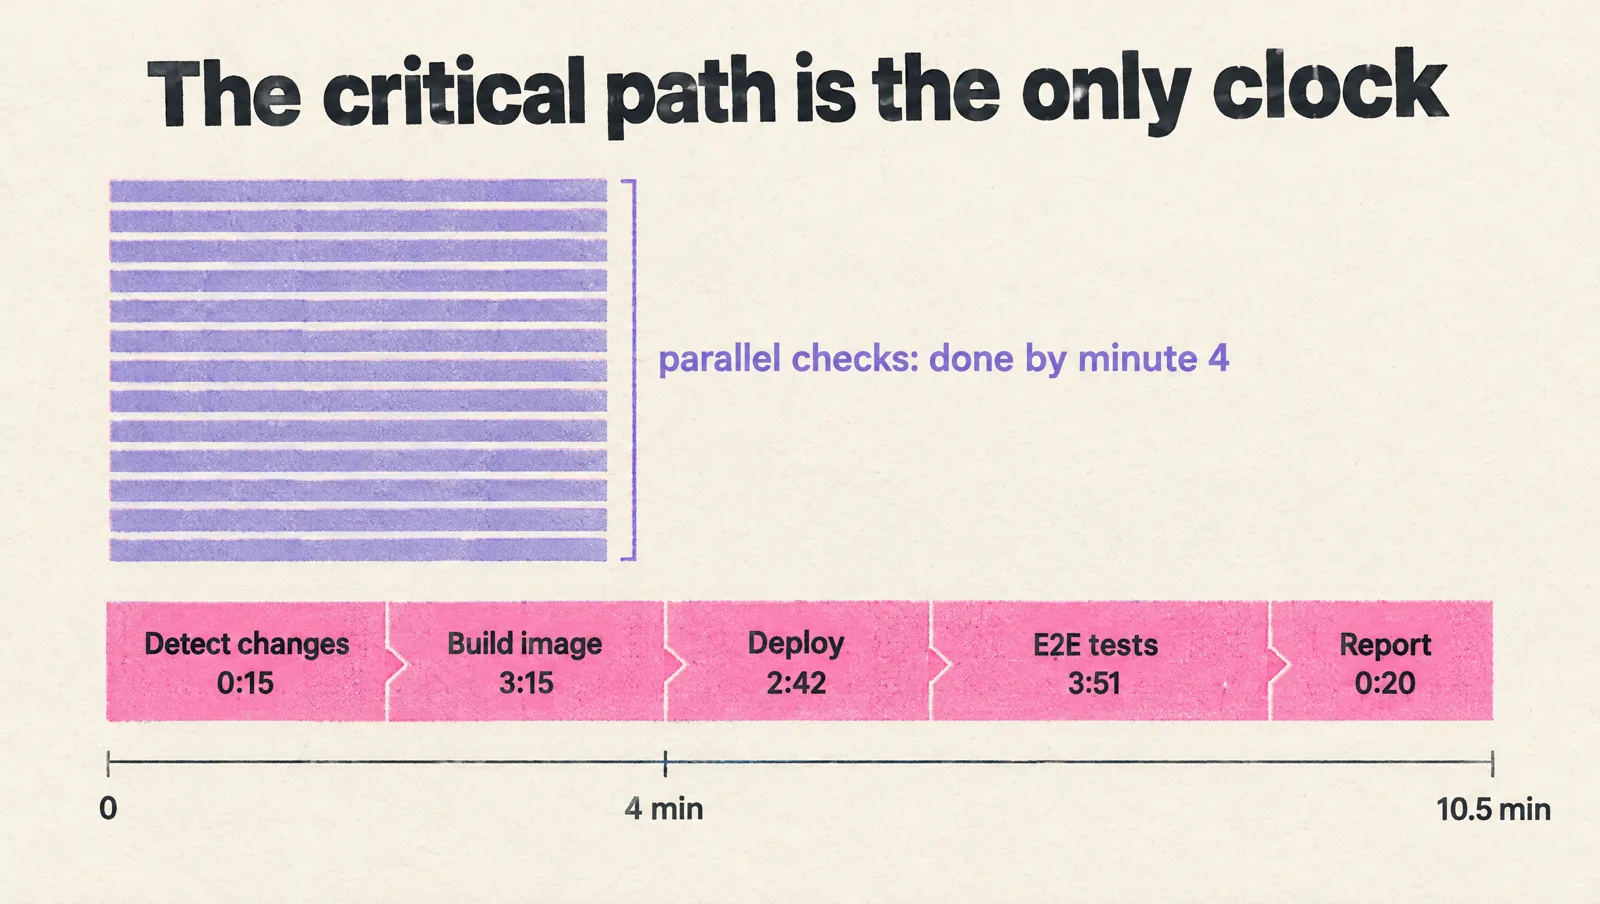
Our pull request (PR) workflow runs 18 jobs.
12 of them start within 15 seconds of the push and run in parallel: unit tests, lint, typecheck, 2 frontends, a security scan, a secrets check, a database branch, the image build.
Those 12 are done by minute 4. The run finishes at 10.5.
The difference is the chain:
Detect changes (0:15) →
Build and push the PR image (3:15) →
Deploy the PR environment (2:42) →
End-to-end (E2E) browser tests (3:51) →
Test report (0:20)
A minute shaved off a job that finishes at minute 4 is a minute you paid for and never see.
How do you find the chain? GitHub keeps a start and an end time for every step of every job.
One API call per run:
gh api repos/OWNER/REPO/actions/runs/RUN_ID/jobs --paginate \
  --jq '.jobs[] | "## \(.name)", (.steps[] | "  \(.started_at) to \(.completed_at)  \(.name)")'
Put the numbers in a table. Next to each slow step, write what it waits for.
| Segment on the critical path | Time | Bound by |
|---|---|---|
| Detect changes and scheduling | 0:15 | GitHub |
| Build and push the Docker image | 3:15 | CPU and registry I/O |
| Cloud Run deploy and preview setup | 2:42 | Cloud APIs |
| E2E: npm ci and browser install | 1:55 | Network |
| E2E: 54 Playwright tests on 2 workers | 1:41 | Worker count, then the app under test |
| Test report | 0:20 | GitHub |
Jobs waited 5 to 10 seconds for a runner. Runner boot time was nowhere in the problem.
I mention it because "faster runner start" was the first thing a vendor pitched me.
Path filters and cancel-in-progress save money, the chain saves minutes
Every guide on this topic opens with the same 3 tips: cancel superseded runs with a concurrency group, skip runs with path filters, cache dependencies.
We had all 3 before I started.
They cut the bill and the queue. They touch the critical path only when a cancelled run was holding a runner yours needed.
Do them, then move on to the chain.
Each slow step waits for 1 of 4 things
CPU = compiling, bundling, running test code.
Network = downloading packages, pulling images, pushing images.
An external API = a cloud deploy, a preview build, a database branch.
The app under test = how fast your own backend answers 54 browsers.
Only the first one gets faster with a bigger machine.
Our E2E job is the example. 3 minutes 51 seconds, which everyone blamed on "weak runners":
- 59 s: npm ci for the webapp (network and disk)
- 56 s: "Install Playwright browsers" (50 s of apt-get for 182 WebKit libraries, 6 s of actual browser download)
- 101 s: running the tests (54 tests, 188 s of summed test time, 2 workers about 90% busy)
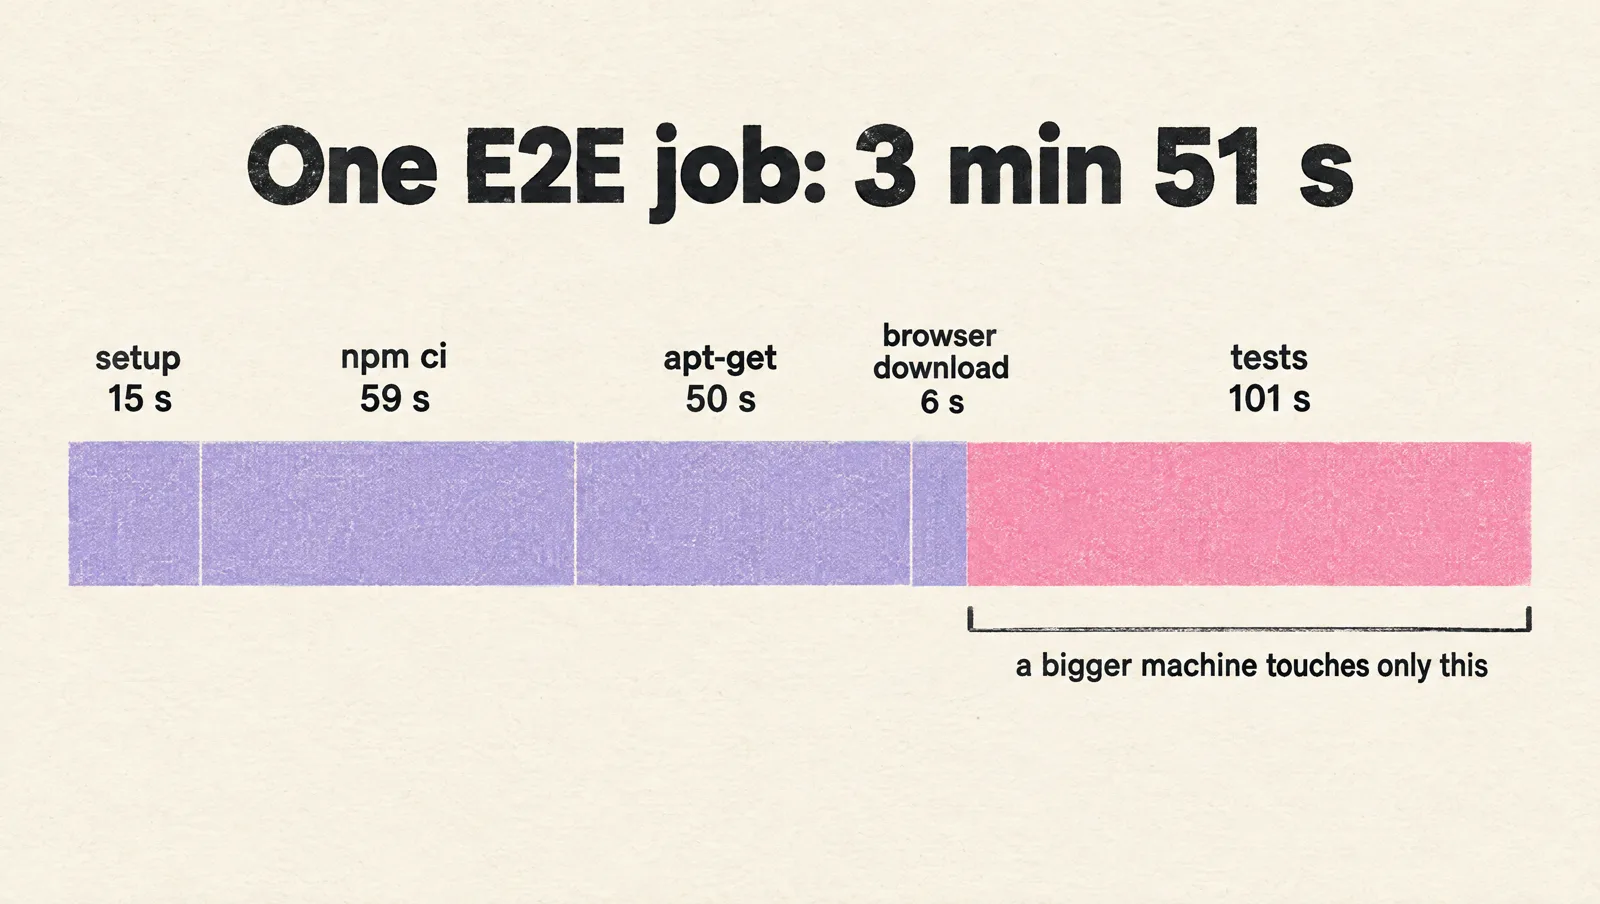
A bigger machine with 8 workers brings the last line to about 30 s. It does nothing for the first 2.
That is the whole "stronger runner" debate in 3 lines.
Then the outliers. 3 runs that month spent 34, 49 and 55 minutes in E2E.
In all 3 the tests themselves ran 96 to 114 s, the same as on a good day.
The rest was apt-get, with gaps of 2 to 5 minutes between packages from the Azure Ubuntu mirror.
Nobody noticed for weeks. The job had no timeout, and GitHub's default is 360 minutes.
Rule: every job gets timeout-minutes at 2x its normal duration. A slow step should fail loudly, so someone looks at it.
Take installs off the critical path
Browsers belong in the image
Playwright publishes a container image with the browsers and their system packages installed.
Run the job inside it. The 56 s step disappears, and the apt-get lottery with it:
e2e:
  runs-on: ubuntu-latest
  container:
    image: mcr.microsoft.com/playwright:v1.64.1-noble
    options: --user 1001
  steps:
    - uses: actions/checkout@v7
    - run: npm ci
    - run: npx playwright test
Pin the tag to the exact Playwright version in your package.json. A mismatch makes Playwright download browsers again.
Playwright's docs say caching the browser binaries is rarely worth it: restoring the cache takes about as long as the download.
Our numbers agree. The download was 6 s. The 50 s was the OS packages.
The image fixes the right thing.
setup-node caches the registry, you still pay for node_modules
The cache: npm option of setup-node caches npm's download cache.
The README says the rest in 1 line: the action does not cache node_modules. Every job still extracts them.
Our root node_modules is 2.5 GB. "Install dependencies" took 27 to 97 s per job, in 7 jobs per run.
Caching the folder itself with actions/cache does little at that size. Restoring 2.5 GB takes about as long as npm ci.
Two things work:
- A persistent disk. Several runner vendors mount a volume that survives between jobs (Blacksmith calls them sticky disks and mounts node_modules on one). The install drops to seconds.
- Fewer jobs that install. Lint, typecheck and unit tests can share 1 job on a bigger runner and install once.
Write shared caches on the default branch
GitHub's rule: a run restores caches from its own branch, from the base branch of its pull request, and from the default branch.
A sibling branch's cache is invisible to it.
So a cache that only pull request jobs write gets written again by every pull request.
We found 11.5 GB of those copies in a repository with a 10 GB cache limit. GitHub was evicting the useful entries to make room.
The fix is a small workflow on the default branch that writes the shared caches (npm, the security scanner's database).
Every pull request then restores on an exact hit and saves nothing.
Docker: keep the layer cache in the registry, write it once
Our image build pulls its layer cache from the registry (cache-from: type=registry). Only the default branch writes it.
A pull request that changed application code and left the lockfile alone hits the npm ci layer. It pays for the TypeScript compile and the push.
That is still 3:15 on a 2 vCPU runner.
The next step down is a remote builder with a layer cache that lives on disk between builds. The runner vendors sell that too.
The step after that is asking whether the pull request needs the image at all before the gate is green.
Start every wait at the start of the run
Our deploy chain was sequential because it was written step by step:
build the image →
deploy it to Cloud Run (1:38) →
write the backend URL into the preview's env vars and trigger the preview build →
run E2E against the preview
3 things were wrong with it. None of them is about compute.
- The preview could have started at second 15. The backend URL is deterministic: the Cloud Run service name comes from the PR number. Everything the preview needs exists before the image does. Trigger it at the start and it builds while the Docker build runs.
- A second deploy for 1 variable. After the first Cloud Run revision we ran a second one to set the portal's preview URL. 40 s on the critical path for a value we knew up front.
- A race hidden by slowness. The preview trigger returns a URL while the preview is still building. E2E worked only because 2 minutes of installs gave the build time to finish. Remove the installs and the tests hit a half built preview. Poll the deployment until it reports READY, then start the tests.
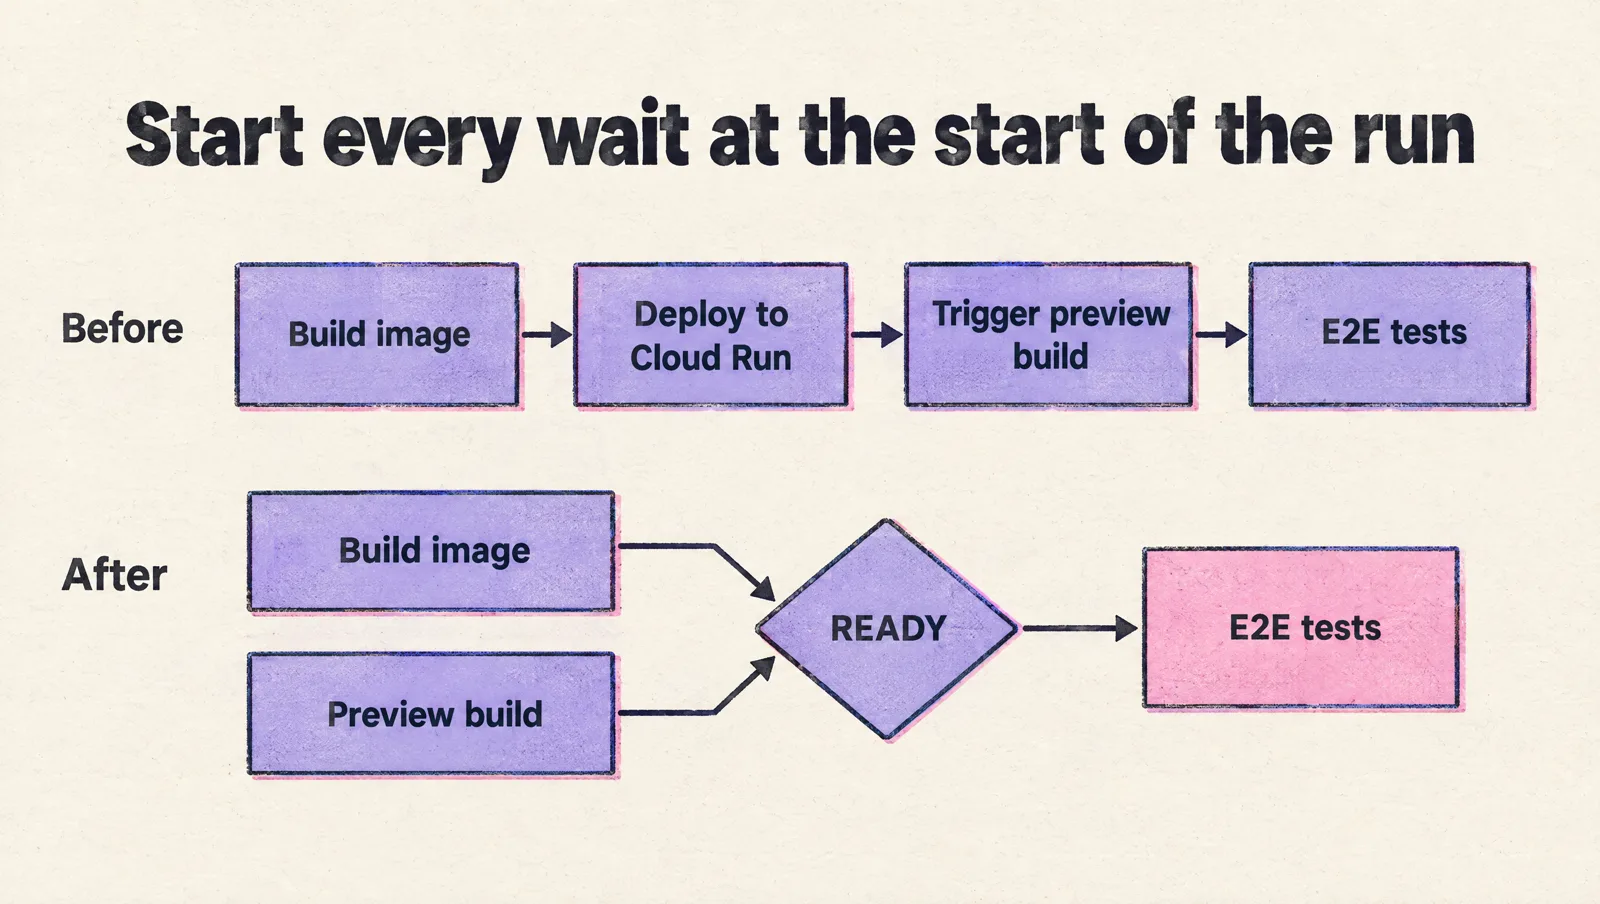
Rule: if a step's inputs are known at the start of the run, start it at the start of the run.
The same thinking applies to the rollout itself.
Cloud Run's startup CPU boost (--cpu-boost) gives the container extra CPU while it starts and for 10 seconds after.
It is 1 flag, and it attacks the only part of a rollout you control: your own container's startup.
Parallelize tests by sharding first, by cores second
2 test suites, 2 different caps.
Unit tests. 576 Jest files, 5,448 tests, 356 s of summed test time, longest file 19.5 s.
The config said maxWorkers: 2, so the job ran 185 s.
Jest's default is the number of cores minus 1. It also accepts a percentage: --maxWorkers=100%.
| Workers | Ideal wall time for our suite |
|---|---|
| 2 | 178 s |
| 4 | 89 s |
| 8 | 45 s |
| 16 | 22 s |
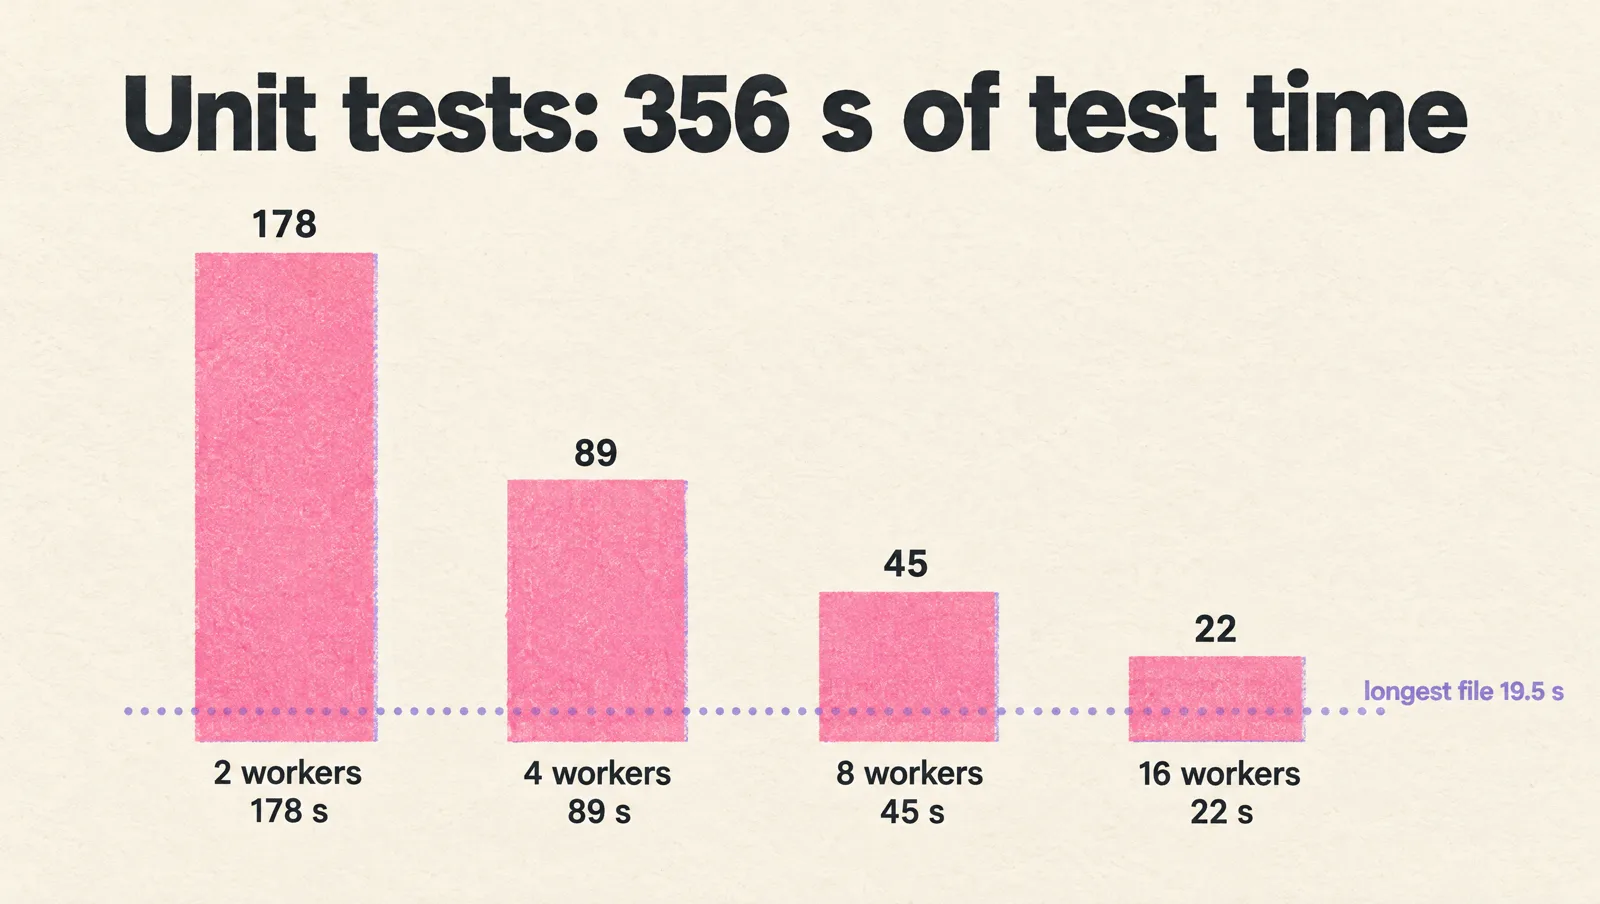
On a standard GitHub runner for a private repository (2 vCPU, 8 GB) the honest ceiling is the first row.
Past that you shard across runners or rent cores.
Browser tests. 54 Playwright tests, 188 s summed, 2 workers, 101 s wall.
Playwright defaults to half the logical cores. 2 was the right number for the runner and the wrong number for the suite.
Sharding gives you the parallelism without a bigger machine:
strategy:
  matrix:
    shard: [1, 2, 3]
steps:
  - run: npx playwright test --shard=${{ matrix.shard }}/3 --reporter=blob
  - uses: actions/upload-artifact@v7
    with:
      name: blob-report-${{ matrix.shard }}
      path: blob-report
A final job downloads the 3 blob reports and runs npx playwright merge-reports --reporter html ./all-blob-reports.
3 shards with 2 workers each is 6 workers. The run step drops to about 35 s.
Each shard pays its own checkout and install. That is why the container image and the persistent disk come first.
One caveat: the app under test.
Our preview backend runs on Cloud Run with 1 vCPU and scales from zero. 8 browsers hitting it at once queue behind 1 Node process.
Give the test environment 2 vCPU and 1 warm instance for the test window. Otherwise the bigger runner ends up measuring your backend.
Buy compute last, and buy the disk first
3 facts about GitHub's own runners, from their docs:
- A standard Linux runner for a private repository has 2 vCPU and 8 GB of RAM
- Larger runners require the Team or Enterprise Cloud plan
- The 1 vCPU
ubuntu-slimrunner is right for the 10 second glue jobs, and has a 15 minute timeout
We are on the Free plan, so the larger runners are off the table.
Vendor runners are a 1 line change (runs-on) and work on any plan.
The ones I looked at (Blacksmith, Depot, Namespace, WarpBuild) sell some mix of 3 things: more cores, a disk that persists between jobs, a Docker layer cache that persists between builds.
Ranked by what they do to the critical path:
- Persistent disk: 27 to 97 s of npm ci becomes seconds, in every job
- Persistent Docker layer cache: our 3:15 image build, mostly an npm ci and a TypeScript compile that did not change, becomes about a minute
- Cores: unit tests from 185 s to about 25 s; typecheck and lint only if their own incremental caches persist too, since tsc runs on 1 thread
And the idea I nearly acted on: GitHub runners on a unikernel cloud with millisecond boots.
Our jobs already waited 5 to 10 s for a runner. The platform's plans cap total running vCPUs below what 1 of our runs fans out to. Running Docker inside it is an enterprise feature.
The step timings killed a fun project in 1 afternoon.
Know the floor before you pick the target
I wanted "under a minute". The data said which parts can get there.
Gate (lint, typecheck, unit tests) = under 1 minute, with persistent caches and a 16 vCPU runner.
Preview environment + E2E = about 4 minutes. The floor is a Cloud Run rollout plus a preview build.
Deploy to staging or production = about 2 minutes, set by the frontend builds and the rollout.
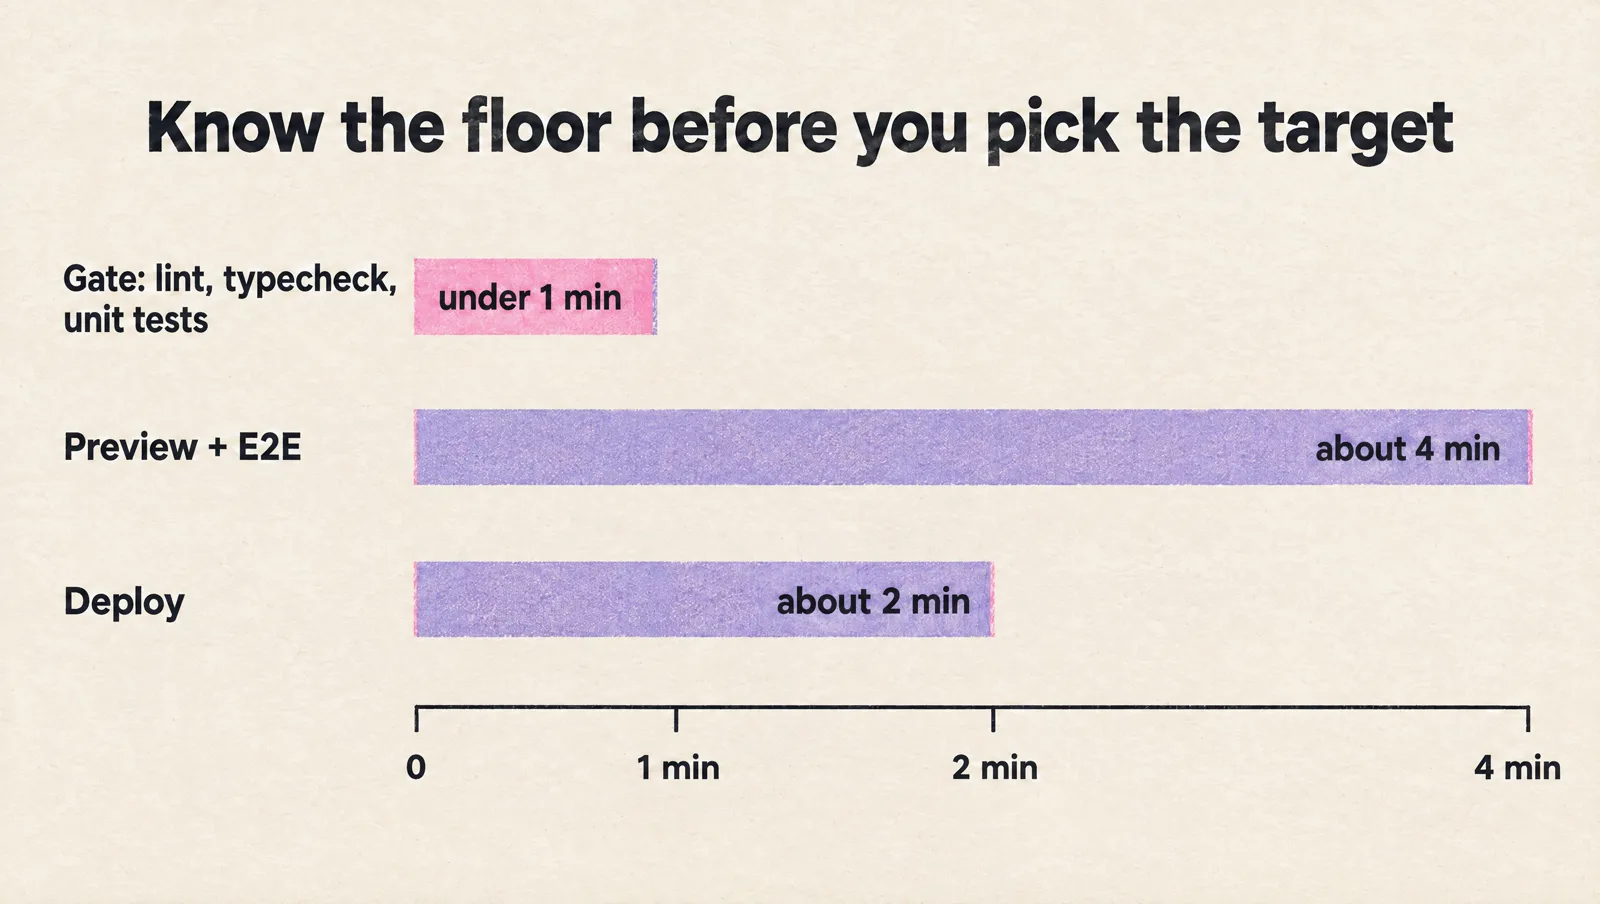
Our frontend builds run 3.8 and 4.8 minutes on the hosting platform's builders.
The only way under that is building them on your own fast runner with a persisted build cache, and shipping the prebuilt output.
So the last question was a product question: what gates the merge?
If the browser tests do, the merge button waits 4 minutes.
If only the gate does, the preview and E2E post their status 3 minutes later, and auto-merge waits for them anyway.
That call belongs to the CTO (I wrote about these calls in The CTO DevOps Handbook). The pipeline's job is to make both lanes fast.
Mistakes I found in our own pipeline
- No job timeouts: a 50 minute apt-get looked like a long test run for weeks. Set
timeout-minuteseverywhere. - Caching the download cache and believing node_modules is cached: read what the setup action caches.
- Caches written only by pull request jobs: every branch writes its own copy until eviction starts. Warm them on the default branch.
- Sequential deploy steps whose inputs were known at the start: 2.5 minutes of waiting that could have overlapped the build.
- A hard coded worker count:
maxWorkers: 2in the config caps every machine you will ever rent. Use a percentage. - Optimizing a parallel job: our check jobs finish by minute 4 of a 10 minute run. Speeding any of them up changes nothing a developer can feel.
- Starting with the vendor: every runner vendor's blog says to switch runners. Measure first, then buy the thing the critical path is made of.
Checklist
Always:
- Pull step timings from the API for 3 recent runs and draw the chain
- Label each slow step: CPU, network, external API, app under test
- Set
timeout-minuteson every job - Run browser tests in an image that already has the browsers
- Know what the setup action caches, and where node_modules comes from
- Write shared caches on the default branch
- Start deploys and preview builds the moment their inputs exist, and poll for READY
- Let test runners use a percentage of cores, and shard before you buy cores
- Size the test environment for the parallelism you just created
- Decide which checks gate the merge before promising a number
FAQ
Why are my GitHub Actions builds so slow?
Because of the longest chain of dependent jobs, and usually 1 step in it that waits for the network or an external API. Pull the per step timings from the jobs API before changing anything. Ours showed a package install first and a cloud deploy second.
Do bigger runners make GitHub Actions faster?
They speed up CPU bound steps: compiles, bundlers, test runners with enough workers. Downloads, deploys and cache restores stay the same, and those were two thirds of our critical path.
Should I cache node_modules in GitHub Actions?
Cache npm's download cache always (setup-node does it for you). Cache node_modules itself only while the folder is small. At 2.5 GB the restore takes as long as npm ci, and the answer becomes a persistent disk on the runner.
How do I speed up Playwright tests in GitHub Actions?
Run the job in the official Playwright container, so the browsers and their system packages are preinstalled. Then shard with --shard=x/y across jobs and merge the blob reports, and check that the app under test can take the extra load.
How do I make my CI/CD pipeline faster without changing tools?
Measure the critical path, put a timeout on every job, start deploys and preview builds early with a READY poll, and shard the test suite. For our pipeline the step timings put those 4 changes at about 7 minutes, down from 10.5, on the same runners.
What is the fastest CI/CD pipeline setup?
A merge gate (lint, typecheck, unit tests) on 1 machine with persistent caches, under a minute. The slower lanes (preview environment, browser tests, deploys) run in parallel and report when they land, with a floor of 1 to 2 minutes for anything that deploys.
How long should a CI pipeline take?
The gate should finish before the coffee does: 1 to 2 minutes. Everything that deploys should finish under 5, because past 10 developers stop waiting and batch their pushes.
A recap
If you take away 1 thing, let it be this: the critical path is the only clock, and most of ours was waiting.
Measure the chain. Remove the installs from it. Start the waits early. Shard the tests. Then buy the disk, then the cores.
You don't NEED a DevOps expert for this. The API call above and 1 afternoon get you most of the way.
If you would rather do it with someone who has done it at 200+ companies, book a free production setup consultation.
P.S. The preview environments that made the E2E lane possible in the first place are their own story: one-click environments.