

Enterprise contracts ask for 1 number, your uptime SLA. Signing 99.9% takes 1 minute. Measuring it takes 1 quarter:
Bottom line
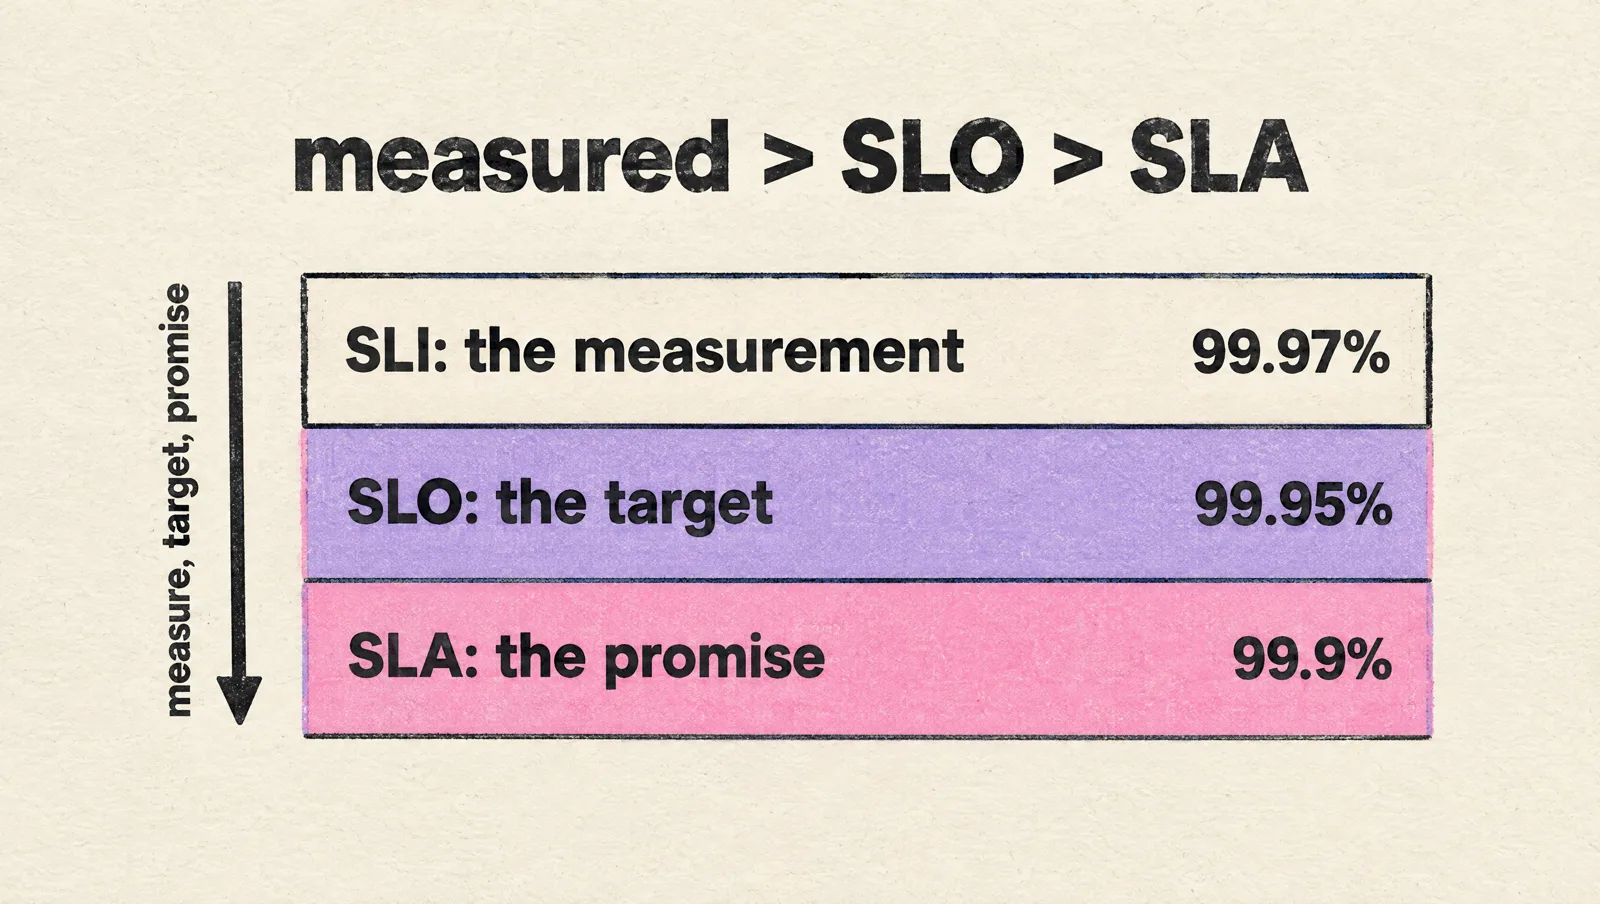
SLI (Service Level Indicator) = the measurement. The share of requests that went well.
SLO (Service Level Objective) = the target your team sets on that measurement.
SLA (Service Level Agreement) = the promise you sign with a customer, with a price for missing it.
They are built in that order: measure, target, promise.
| SLI | SLO | SLA | |
|---|---|---|---|
| What it is | A measurement | An internal target | A contract clause |
| Who owns it | Engineering | Engineering and product | Sales, legal and the CTO |
| Who sees it | The team | The company | The customer |
| When it is missed | Nothing, it is a fact | The team shifts to reliability work | You pay service credits |
| Example | 99.97% of API requests succeeded in the last 30 days | 99.95% of API requests succeed over 30 days | 99.9% monthly uptime, or 10% of the monthly fee back |
The rule of this article: measured > SLO > SLA.
Your SLA is looser than your SLO, and your SLO is looser than what you measured. Each gap is your margin.
The targets I set for a B2B SaaS product API: an SLO of 99.95% over a rolling 30 days and an SLA of 99.9% per calendar month, after 1 quarter of measuring.
Below: how to define the SLI, how to pick the SLO, what an error budget buys you, what goes into the SLA clause, and the alerts that tell you before the customer does.
SLI, SLO and SLA are 3 layers of the same number
Start from 1 user request.
request → good or bad →
SLI: the share of good ones →
SLO: the share you aim for →
error budget: the bad ones you can afford →
SLA: the share you promise, with margin →
credits: what a miss costs you
Google's SRE book gives a 1 question test for telling an SLO from an SLA: "what happens if the SLOs aren't met?"
If there is no explicit consequence, it is an SLO.
If a contract names a consequence, usually money back, it is an SLA.
So an SLA always contains an SLO. The reverse is optional, and for most of your services it should stay that way.
SLO = a decision tool for you.
SLA = a commitment to someone else.
The same book defines an SLI as "a carefully defined quantitative measure of some aspect of the level of service". Carefully defined is the part that takes work, so it comes first.
An SLI is good events divided by all events
SLI = good events / total events.
That is the form Google's SRE workbook recommends, and it works for every kind of service:
| Service type | SLI | Good event |
|---|---|---|
| API or web app | Availability | A request answered without a server error |
| API or web app | Latency | A request answered in under 300 ms |
| Data pipeline | Freshness | A record processed within 10 minutes |
| Data pipeline | Correctness | A record with the right output |
| Storage | Durability | An object that can still be read |
3 choices decide whether the number means anything:
- Measure where the user is. The workbook uses load balancer metrics because they are "closer to the user's experience" than the application server's logs. A crashed pod reports no errors, and the load balancer in front of it does
- Measure a real user flow. Login, the core API call, checkout. A health check on /health can be green while checkout fails
- Use a threshold for latency. "Requests under 300 ms" is a ratio you can target. An average hides the slow 1% that your biggest customer lives in
An availability SLI in Prometheus, from the request counter most HTTP frameworks already export:
sum(rate(http_requests_total{job="api",code!~"5.."}[30d]))
/
sum(rate(http_requests_total{job="api"}[30d]))
The query needs 30 days of metrics, and Prometheus keeps 15 days by default, so raise the retention first. If your ingress or load balancer exports its own request counter, count from that one.
If you have no metrics yet, the load balancer's access logs give you the same 2 counts. The startup observability stack article covers the tooling.
Rule: 2 SLIs per user-facing service, availability and latency. Add a third when a customer complains about something the first 2 missed.
An SLO is a target, a window, and an error budget
SLO = SLI target + time window.
"99.9% of API requests succeed, over a rolling 30 days."
The workbook's general-purpose window is 4 weeks, rolling. I use 30 days because the cloud SLAs you depend on count in months.
The useful half of an SLO is what it leaves over.
Error budget = 1 minus the SLO.
At 99.9% you may fail 0.1% of requests. With 10 million requests a month, that is 10,000 failed requests you are allowed.
In time, over 30 days:
| SLO | Error budget | Full downtime it allows in 30 days |
|---|---|---|
| 99% | 1% | 7 hours 12 minutes |
| 99.5% | 0.5% | 3 hours 36 minutes |
| 99.9% | 0.1% | 43 minutes |
| 99.95% | 0.05% | 21 minutes 36 seconds |
| 99.99% | 0.01% | 4 minutes 19 seconds |
| 99.999% | 0.001% | 26 seconds |
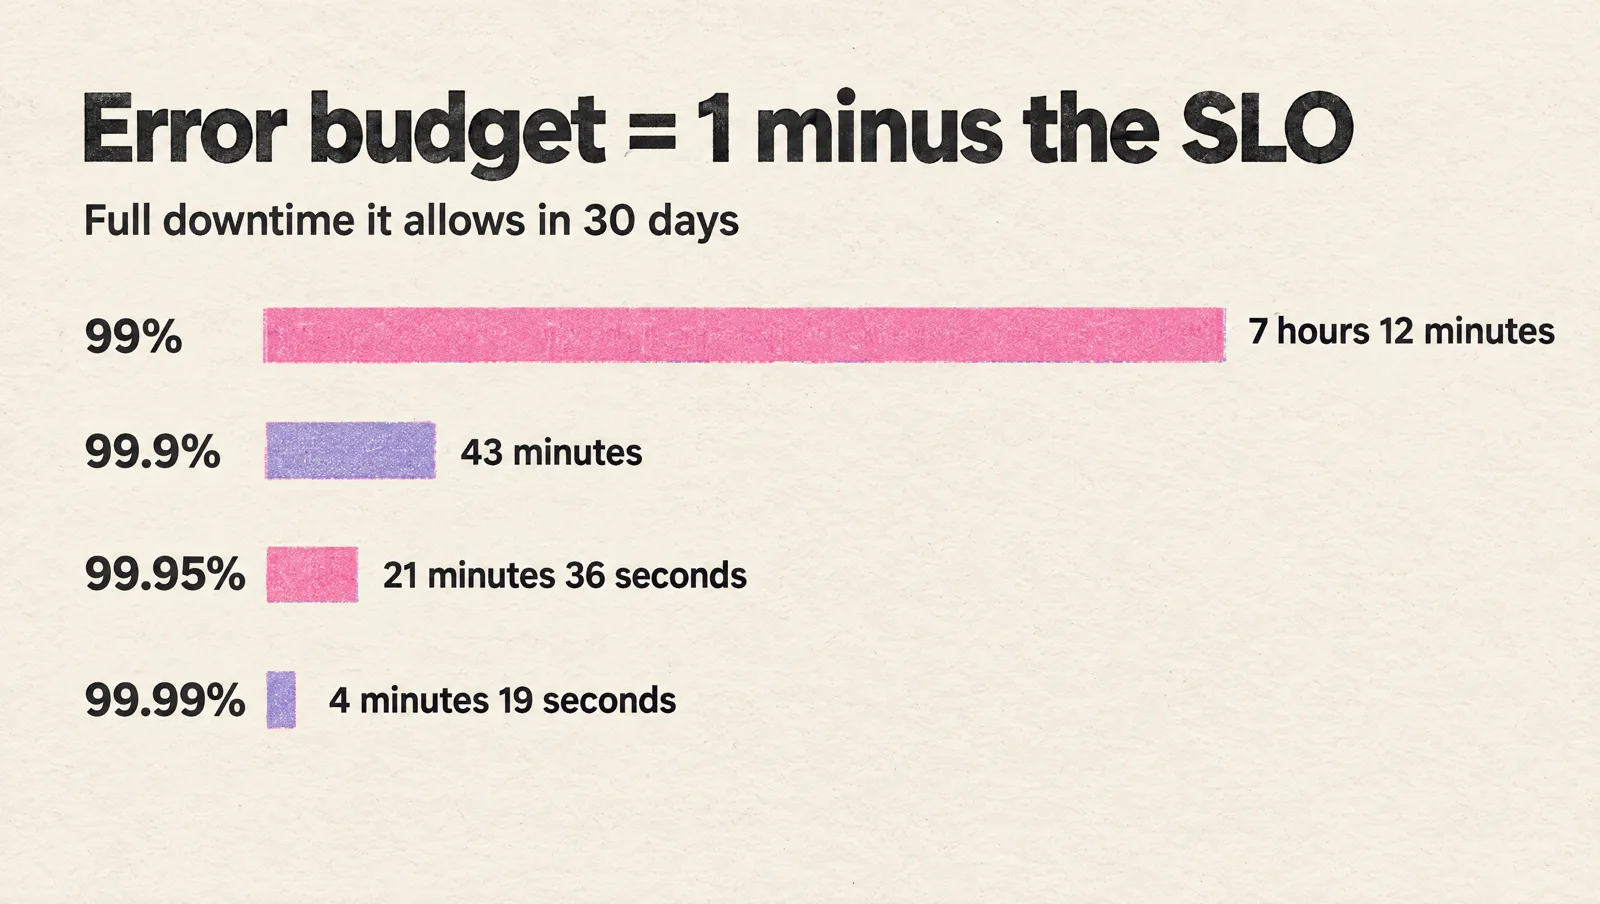
A request-based SLO spends the same budget in failed requests, so 10 minutes down at peak costs more than 10 minutes down at 3 AM.
Read the table as a staffing plan.
43 minutes covers 1 incident where a person is paged, wakes up, finds the cause and rolls back.
4 minutes covers none. At 99.99% every recovery has to be automatic, because the budget is gone before a human opens the laptop.
5 nines leaves 26 seconds a month. (Enough time to read the alert.)
How to pick the number
Google's SRE book lists 5 rules for choosing targets:
- "Don't pick a target based on current performance"
- "Keep it simple"
- "Avoid absolutes"
- "Have as few SLOs as possible"
- "Perfection can wait"
The workbook is blunter about the absolute: "100% reliability is the wrong target". A 100% target leaves no room for change, and change is the leading cause of outages.
How I apply the 5 rules at a startup:
- Measure the SLI for 4 weeks before choosing anything
- Ask what the user needs. An internal admin tool at 99% is fine. A payments API at 99% loses customers
- Start the product API at 99.9% while no SLA exists, and move to 99.95% before you sign a 99.9% SLA
- Promise 99.99% only when failover is automatic and a drill has proven it
The opposite mistake is real too. Google's SREs found that a service running far above its SLO teaches users to depend on the extra.
Their fix for Chubby, an internal lock service: in a quarter with no real failure, they take the system down on purpose.
At a startup the cheaper version is to spend the budget: ship faster, run the risky migration, do the cluster upgrade in daylight.
An unspent error budget = features you didn't ship.
Check your SLA against the SLAs you run on
Your service sits on top of other people's promises. Dependencies in a row multiply.
The AWS numbers, from its SLA pages:
| AWS service | Setup | Monthly uptime in the SLA |
|---|---|---|
| EC2 | Instances in 2 or more availability zones | 99.99% |
| EC2 | A single instance | 99.5% |
| RDS | Multi-AZ | 99.95% |
| RDS | Single instance | 99.5% |
| Elastic Load Balancing | Across 2 or more availability zones | 99.99% |
A request that needs the load balancer, the compute and the database:
99.99% × 99.99% × 99.95% = 99.93%
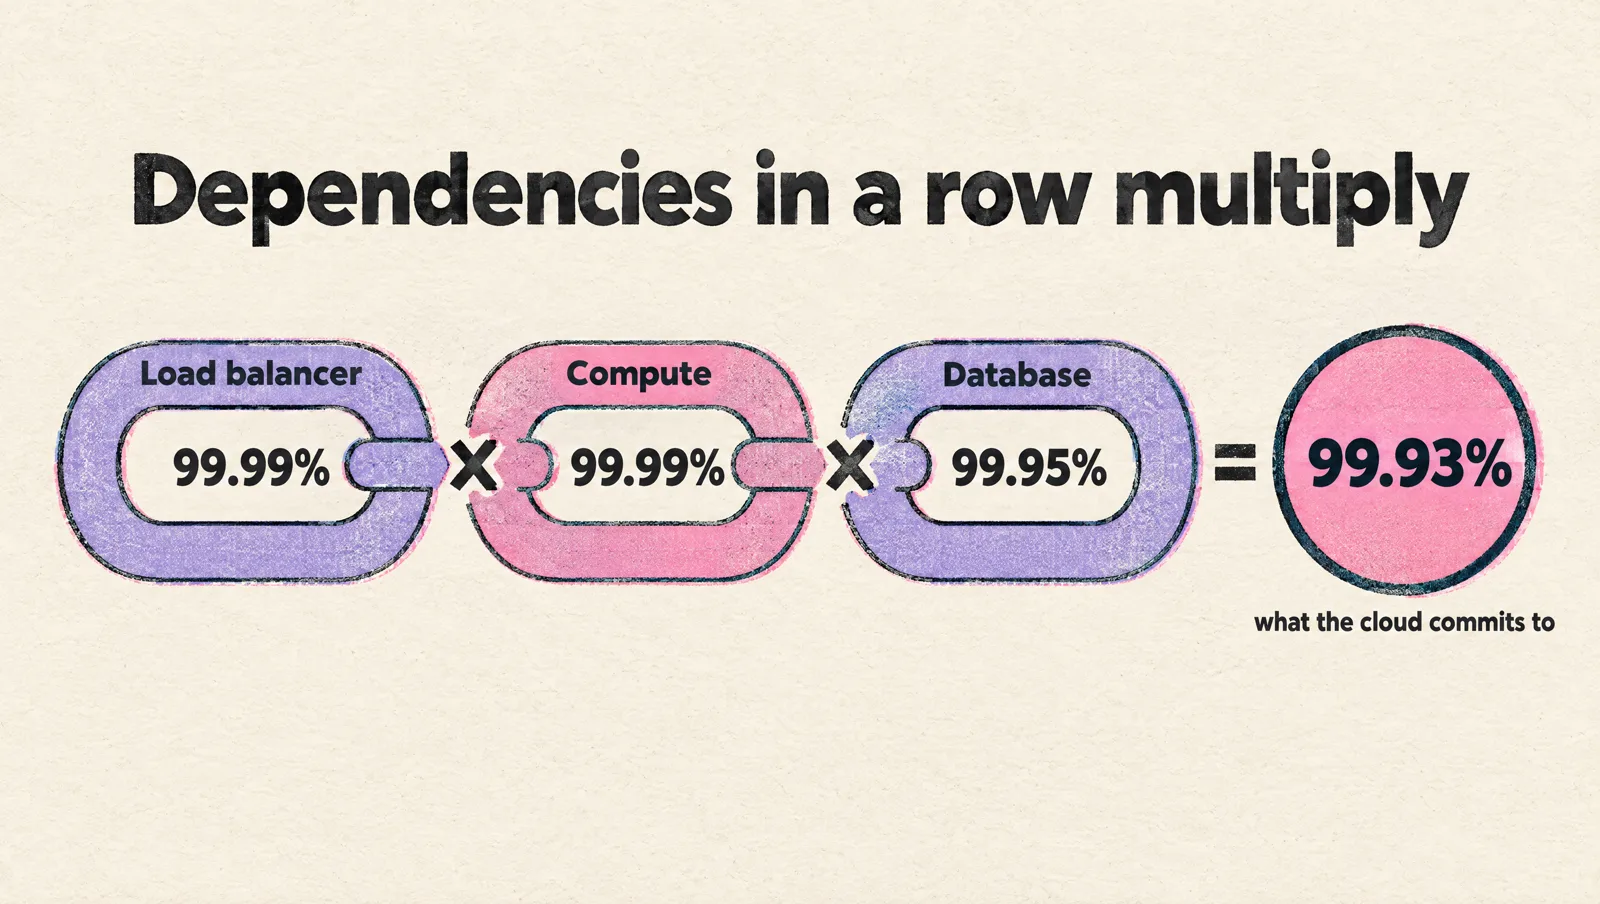
That is what the cloud commits to before your own code fails once: the level AWS pays credits below.
An SLA of 99.95% on top of it is a promise your suppliers never made to you.
Run the database on a single instance and the chain drops to about 99.48%. Signing 99.9% on that setup is a bet.
The provider's SLA is the floor it pays for missing. Real availability is usually higher, and your measurement is how you find out by how much.
Redundancy is the lever that raises the ceiling, and it has a price. The RTO vs RPO article lays out what each level costs.
An SLA is an SLO with a price
An SLA clause has 6 parts. Check each one before you sign, on either side of the table:
- The metric: what counts as "available", and who measures it
- The window: usually a calendar month
- The target: the percentage
- The exclusions: scheduled maintenance, the customer's own outages, beta features, force majeure
- The remedy: a service credit schedule
- The claim process: who has to notice, and by when
AWS's EC2 SLA is a good model to read, because it is short:
| Monthly uptime of the region | Service credit |
|---|---|
| Below 99.99%, down to 99.0% | 10% |
| Below 99.0%, down to 95.0% | 30% |
| Below 95.0% | 100% |
2 details in it are worth copying.
The remedy is a credit against future bills, 100% of that month's EC2 charge at most.
The customer has to claim it: a support case, received by the end of the second billing cycle after the incident. A credit nobody claims is never paid.
Which also means: if your cloud bill is large and your region had a bad month, someone on your team should be opening that case.
A clause to hand your lawyer
Provider will make the Service available with a Monthly Uptime Percentage of at least 99.9%. Monthly Uptime Percentage is the share of minutes in a calendar month in which the production API, measured at Provider's load balancer, answers at least 99% of requests with a response other than a 5xx error. Minutes in which the Service is unreachable count as unavailable. Scheduled maintenance announced 72 hours ahead, failures caused by Customer's systems, beta features and force majeure events are excluded. If the Monthly Uptime Percentage falls below 99.9%, Customer may request a service credit of 10% of that month's fee, or 25% if it falls below 99.0%. Requests must be made within 30 days of the end of the month. Service credits are Customer's sole and exclusive remedy for a failure to meet this commitment.
It is a draft for your lawyer, with the engineering parts already in: a metric defined per minute, a named measuring point, a window, the exclusions and a remedy with a ceiling.
Track it on its own dashboard. The SLA counts calendar months and the SLO counts a rolling 30 days, so the 2 numbers differ on most days.
The 3 rules I hold when sales brings a contract:
- SLA = SLO minus margin. Google Cloud's SRE fundamentals post gives an SLA of 99.9% backed by an internal SLO of 99.95%. You can spend the whole SLO budget and still have half the SLA's budget left
- Promise what a quarter of measurement has shown. A number copied from a competitor's pricing page is a guess
- Price the extra 9. A customer who needs 99.99% is asking for a second availability zone everywhere, automatic failover and 24/7 on-call. That is a different tier with a different price
The SLA glossary entry has the shorter definition if you need to send one to a colleague.
Alert on how fast the error budget burns
An SLO gives you the 1 alert worth waking up for: the budget is burning too fast.
The workbook's definition: "Burn rate is how fast, relative to the SLO, the service consumes the error budget."
Burn rate 1 = the budget lasts exactly the 30 days.
Burn rate 10 = it is gone in 3 days.
Burn rate 1,000 = everything is failing, and a 99.9% budget is gone in 43 minutes.
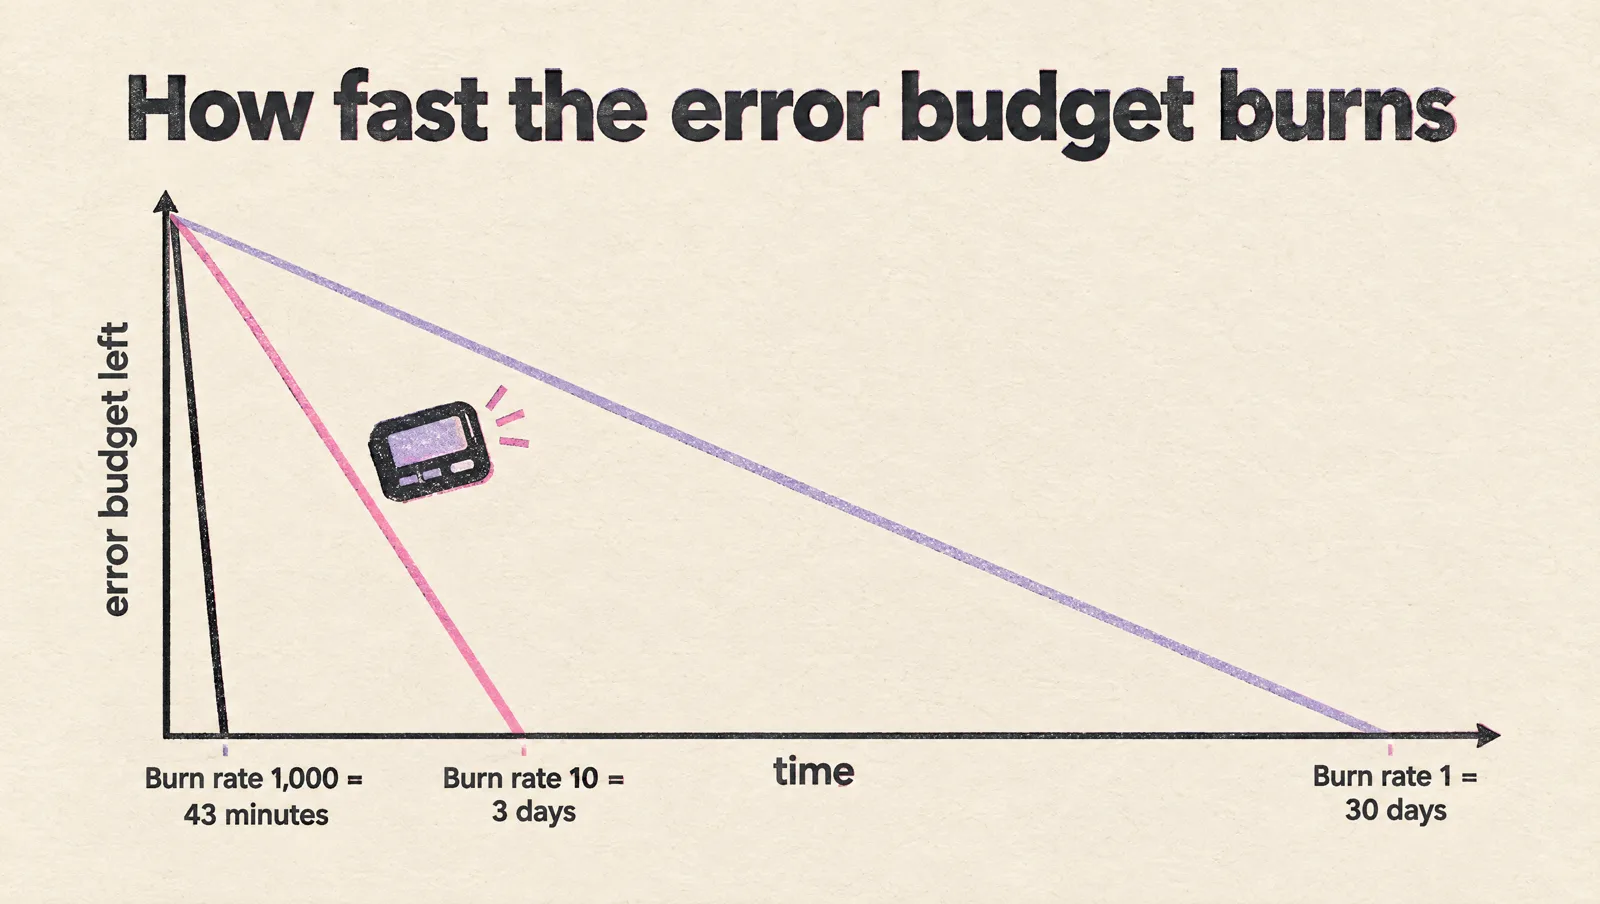
The alert setup Google recommends for a 99.9% SLO:
| Action | Burn rate | Long window | Short window | Budget consumed |
|---|---|---|---|---|
| Page | 14.4 | 1 hour | 5 minutes | 2% |
| Page | 6 | 6 hours | 30 minutes | 5% |
| Ticket | 1 | 3 days | 6 hours | 10% |
The long window proves the problem is real. The short window proves it is still happening, so the page stops soon after the fix.
The paging rule in Prometheus, in the workbook's shorthand (0.001 is the error budget of a 99.9% SLO; for 99.95% use 0.0005):
expr: (
        job:slo_errors_per_request:ratio_rate1h{job="myjob"} > (14.4*0.001)
      and
        job:slo_errors_per_request:ratio_rate5m{job="myjob"} > (14.4*0.001)
      )
    or
      (
        job:slo_errors_per_request:ratio_rate6h{job="myjob"} > (6*0.001)
      and
        job:slo_errors_per_request:ratio_rate30m{job="myjob"} > (6*0.001)
      )
severity: page
Each ratio_rate series is a recording rule: errors divided by requests over that window.
2 pages and 1 ticket replace the CPU and memory pages that wake people for things users never felt. Disk space and certificate expiry stay as tickets.
That swap is most of the cure for alert fatigue.
One warning for small products, with the workbook's own numbers: at 10 requests an hour, 1 failed request is a burn rate of 1,000.
Its options: synthetic traffic, combining small services into 1 SLO, or lowering the SLO or lengthening its window. I start with the longer window.
Decide what happens when the budget runs out
An SLO with no consequence inside the company is a dashboard.
The consequence is an error budget policy, agreed while everyone is calm. Google publishes its example, and 3 lines carry it:
- Budget spent: "we will halt all changes and releases other than P0 issues or security fixes until the service is back within its SLO"
- 1 incident eats more than 20% of the budget: the team must conduct a postmortem
- The teams disagree: "the issue should be escalated to the CTO to make a decision"
The startup version I use fits in 4 lines:
- Budget left: ship whenever you want
- Half the budget gone in the first week: the on-call engineer reviews every deploy until the window recovers
- Budget spent: the next sprint's first items are reliability work
- 1 incident over 20% of the budget: a written postmortem with 1 fix that gets done
Why does a CTO want this? Because "should we slow down and fix reliability" stops being an argument between product and engineering.
The number answers it every Monday.
The error budget is the only reliability metric I know that tells a team when to go faster.
The SLO document, on 1 page
1 page per user-facing service, under 8 headings:
- Service and user flow: what the user is doing ("call the public API")
- SLI: the good event, the total event, and the query that counts both
- SLO: the target and the window
- Error budget: in requests and in minutes
- Alerts: the burn rates that page and the one that opens a ticket
- Policy: what happens at half spent and at fully spent
- External SLA: the number in contracts, and the margin to the SLO
- Owner and review date: a name, and a quarterly check that the target still matches what users need
Heading 7 is the one sales should read before the next enterprise call.
Mistakes I keep seeing
- An SLA signed before any SLI exists: the first measurement arrives with the customer's complaint
- SLA equal to the SLO: every internal miss is a contract breach
- The SLO copied from last month's graph: current performance is where you start measuring, and the user's need is what sets the target
- A 100% target: no deploy is safe under it
- Uptime measured by a ping on /health: the health check passes while the checkout fails
- Average latency as the SLI: the slowest 1% is invisible in it
- 15 SLOs per service: nobody can say which one matters during an incident
- 99.99% promised on a single database instance: the supplier's own SLA for it is 99.5%
- Cloud credits nobody claims: the provider waits for your support case
Checklist
Always:
- Define 2 SLIs per user-facing service: availability and latency, as good events over total events
- Measure at the load balancer, on a real user flow
- Measure for 4 weeks before setting a target
- Set 1 SLO per SLI with a 30 day window, and write the error budget in minutes and in requests
- Multiply your dependencies' SLAs and check the SLA you sign sits under the result
- Page on burn rate 14.4 and 6, ticket on burn rate 1
- Write the error budget policy before the first incident
- Sign an SLA only with a quarter of measurements behind it, looser than the SLO
- Put exclusions, a credit schedule, a claim deadline and a sole remedy line in every SLA
- Review each SLO every quarter with product in the room
FAQ
What's the difference between SLOs and SLAs?
An SLO is an internal target your team sets for a service. An SLA is a contract with a customer that includes a consequence, usually service credits, for missing a target. Set the SLO tighter than the SLA, so you find out about a problem before it costs you money.
Is an SLO part of an SLA?
Yes. Every SLA contains at least 1 objective, the number being promised, plus the consequence for missing it. Most SLOs have no SLA around them: they exist so the team can decide between shipping and fixing.
What is the difference between SLI, SLO and SLA?
The SLI is the measurement (99.97% of requests succeeded). The SLO is the target on it (99.95% over 30 days). The SLA is the promise to a customer (99.9% monthly, or credits). Measure, target, promise, in that order.
What is an example of an SLO?
"99.9% of requests to the public API return a successful response, measured at the load balancer over a rolling 30 days." A latency SLO for the same service: "95% of requests complete in under 300 ms over a rolling 30 days."
What is an error budget?
1 minus the SLO. A 99.9% SLO leaves a budget of 0.1%: about 43 minutes of full downtime in 30 days, or 10,000 failed requests out of 10 million. While budget remains the team ships; when it is spent the team works on reliability.
Which comes first, the SLO or the SLA?
The SLO, with the SLI before it. Run the SLO for a quarter, see what you achieve, then offer an SLA with margin below it. An SLA signed first means the customer's contract is setting your engineering priorities.
Does every service need an SLA?
No. Internal services and free tiers run on SLOs alone. Sign an SLA when a paying customer asks for one, and only for the service that customer uses.
Is 99.9% uptime good?
For most B2B SaaS products, yes. It allows 43 minutes of downtime in 30 days, which a small on-call team can meet with 1 region and 2 availability zones. 99.99% allows 4 minutes and needs automatic failover everywhere.
Who owns the SLO?
The team that runs the service owns the measurement and the alerts. Product agrees to the target, because the target decides how much time goes to features. The CTO owns the tie-break, and signs off on any SLA built on top.
A recap
If you take away 1 thing, let it be this: measured > SLO > SLA.
Measure the SLI where the user is. Set the SLO from what the user needs.
Spend the error budget on shipping. Page on the burn rate.
Sign the SLA last, with margin.
You don't NEED a DevOps expert for the first SLO. A load balancer log, a spreadsheet and 4 weeks get you the first honest number.
If you would rather set it up with a team that has worked with 200+ companies, book a free production setup consultation.
P.S. The on-call rotation that answers those 2 pages is its own design problem. I wrote about it in how to design on-call before you hire an SRE.