


If you are searching for a Datadog alternative, the problem is usually the bill, and a new tool is 1 of 5 ways to fix it:
Bottom line
There are 5 routes away from your current Datadog bill, and only 4 of them change the tool.
- Stay and cut the bill: fewer indexed logs, fewer tag combinations, a commitment that fits
- Another commercial platform: New Relic, Dynatrace, Honeycomb, Elastic
- Managed open source: Grafana Cloud, SigNoz Cloud
- Self-hosted open source: Prometheus, Grafana, Loki and Tempo, or SigNoz, or VictoriaMetrics
- Your cloud's own monitoring: Amazon CloudWatch, Google Cloud Observability
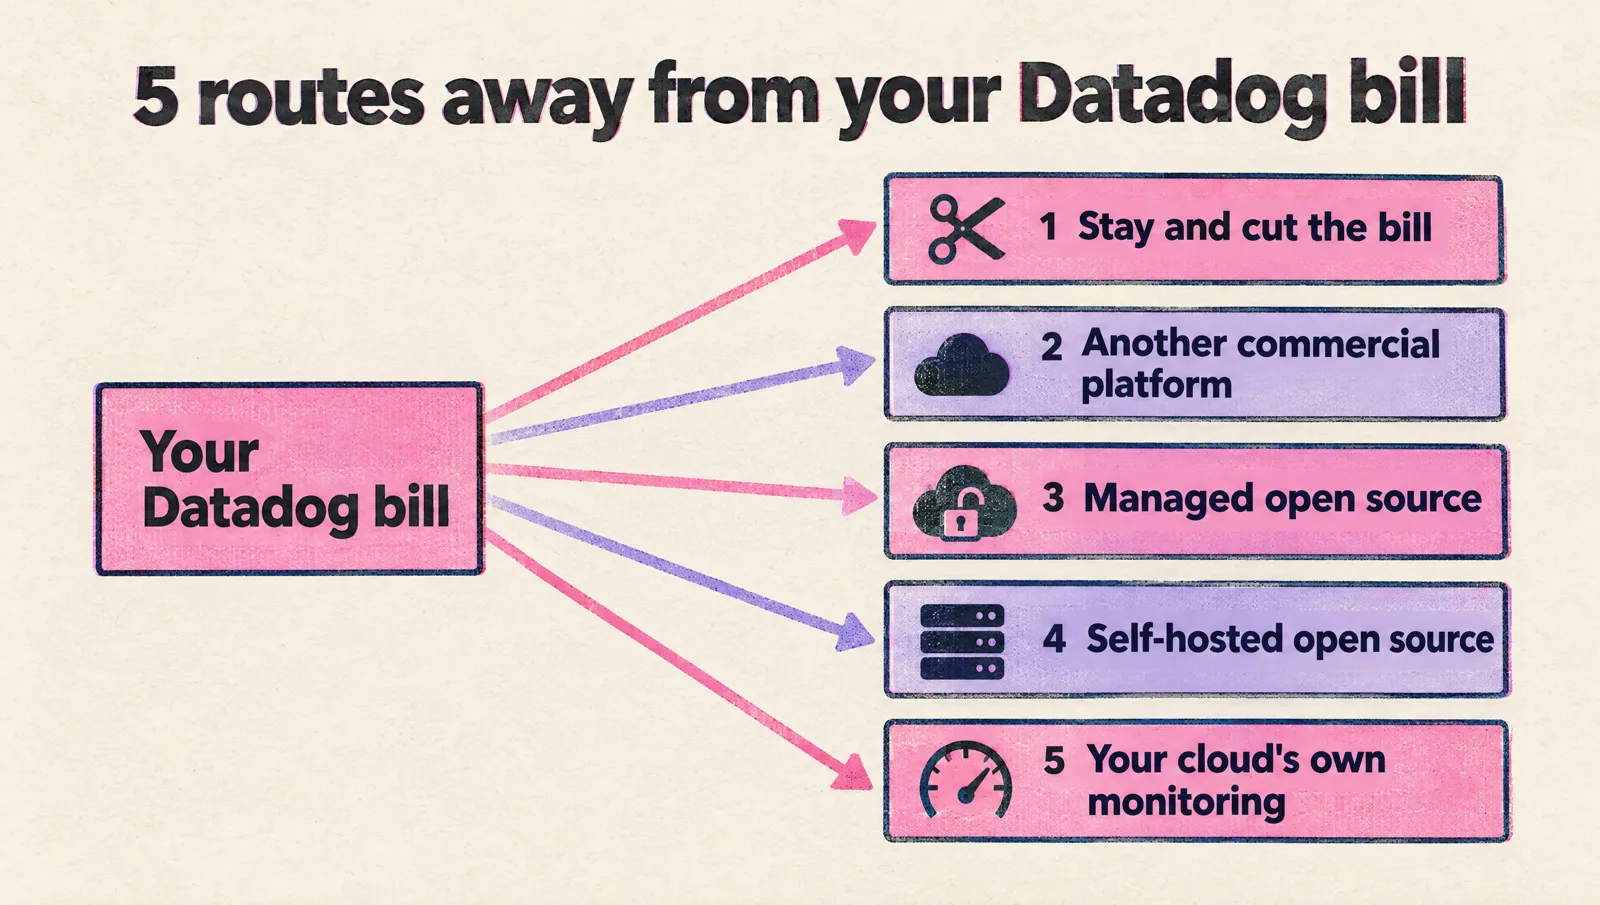
Here is where I would start, by situation:
| Your situation | Start with |
|---|---|
| The bill grew, the tool works | Route 1, then compare |
| You are leaving, with under 20 engineers and nobody to run a monitoring stack | Grafana Cloud or SigNoz Cloud |
| Data has to stay in your own cloud account | Self-hosted Grafana stack or SigNoz |
| You debug requests across many services all day | Honeycomb |
| A large company that wants one vendor and one contract | Dynatrace or New Relic |
| One cloud, a few services, a small budget | CloudWatch or Google Cloud Observability |
Whatever you pick, the price of the new tool is the smaller cost.
The bigger one is moving your instrumentation, your dashboards and your monitors.
So do one thing before you pick: send your telemetry through OpenTelemetry. After that, changing the tool is a change of address.
All prices here are public list prices in USD, checked on November 15, 2026 against each vendor's pricing page. Your contract can differ.
Is the Datadog bill the reason you are reading this? Our senior engineers assess your setup, plan the work and do it hands-on, paid by the hour with no lock-in. Book a free 30-minute consultation.
Find your situation:
- The renewal is close and you need a number: 500 GB of logs and 20,000 metrics, priced on each tool
- You want to keep Datadog and pay less: Route 1
- You want open source and no servers to run: Route 3
- You already decided to leave: move to OpenTelemetry first, then run both side by side
Know what you use before you compare tools
Datadog is a price list of separate products. So is every alternative.
Before you open a comparison page, write down which of these you use today:
- Infrastructure metrics and the integrations that feed them
- Application tracing (APM)
- Logs: search, pipelines, archives
- Dashboards and monitors
- Synthetic tests and real user monitoring (RUM)
- On-call and incident tooling
Then write down why you want to leave. There are 4 honest reasons:
- The bill: it grows faster than the system
- Lock-in: your code and your agents speak one vendor's format
- Data location: telemetry must stay in your account or your region
- Fit: you use 2 products out of 20 and pay for a platform
Reason = route. A bill problem starts at Route 1. A data location problem starts at Route 4.
(A fifth reason exists: someone saw a nicer dashboard at a conference. It is the most expensive one.)
Route 1: Cut the Datadog bill and stay
This is the cheapest route, and the one that gets skipped.
In my Datadog pricing breakdown, a setup of 50 hosts costs $4,360 a month at list price. 3 changes bring it to $2,953:
- Exclusion filters on the log indexes, so you ingest everything and index a part of it
- Fewer queryable tags on the custom metrics that multiply
- APM only on the hosts that send traces you read
None of them needs a new tool, a migration or a retrained team.
Do this first even if you plan to leave. The filters and the tag cleanup carry over: every tool on this page bills you for volume in some unit.
Stay when the bill after the cleanup is one you can defend. Leave when it is still too high, or when the reason was never the bill.
Route 2: Another commercial platform
These are full platforms run by a vendor. You swap one bill for another, with a different unit.
| Tool | What sets the bill | List price | Fits |
|---|---|---|---|
| New Relic | GB ingested, plus full platform users | 100 GB a month free, then $0.40 per GB. Full platform users: $10 for the first and $99 for each of the next 4 on Standard (5 at most), $349 each on Pro with an annual commitment | Teams that want one product for everything and have few people who need full access |
| Dynatrace | Memory of the monitored hosts, per hour, plus GiB ingested | Full-Stack Monitoring: $0.01 per memory-GiB-hour ($58 a month for an 8 GiB host). Logs: $0.20 per GiB to ingest | Large companies that want automatic instrumentation and an annual contract |
| Honeycomb | Events sent | Free up to 20 million events a month. Pro starts at $150 a month for 50 million events | Teams that debug with traces and wide events, with unlimited seats |
| Elastic Observability | GB ingested and GB retained | Serverless, Complete tier: ingest "as low as" $0.09 per GB, retention $0.019 per GB a month | Teams that already run Elasticsearch and are heavy on logs |
3 things to check before you sign:
- New Relic users: Standard allows 5 full platform users, for $406 a month. From the 6th you are on Pro, where 5 users cost $1,745 a month before 1 GB of data. Basic users are free and can see dashboards. Count who needs more
- Dynatrace commitment: the pricing page describes a minimum annual spend commitment and prints no amount. Ask for it in the first call
- Dynatrace host size: a 32 GiB node costs 4 times the 8 GiB price for Full-Stack Monitoring. Check the memory of your nodes before you read the $58
Coralogix and Better Stack also show up on these shortlists. Both price per GB, and both prices depend on the pipeline or the region you choose, so read the full table before you compare.
New Relic, Dynatrace, Honeycomb and Elastic all accept OpenTelemetry data over OTLP (the OpenTelemetry Protocol). That matters for the switch, below.
Route 3: Managed open source
The software is open source. Someone else runs it. You pay for usage, and you can take the same software in-house later.
For most startups leaving Datadog, this is the route I would take.
Grafana Cloud
Grafana Cloud is the hosted version of the Grafana stack: Mimir for metrics, Loki for logs, Tempo for traces, Grafana for dashboards.
- Free plan: 10,000 active metric series, 50 GB of logs, 50 GB of traces, 14 days of retention, 3 users
- Pro plan: $19 a month platform fee with the same amounts included, then pay as you go
- Metrics: from $6.50 per 1,000 active series, kept 13 months
- Logs and traces: $0.05 per GB to process, $0.40 to write and $0.10 to retain, so $0.55 per GB, kept 30 days
- Users: from $8 per active Grafana user a month
The unit to watch is the active series. Every label value you add creates new series, exactly like tags create custom metrics in Datadog.
One more line to plan for: Grafana Cloud's Kubernetes Monitoring app is billed separately, by the host hour ($0.01, about $7.20 a node a month) and the container hour ($0.0007, about $0.50 a container a month), on top of the series and GB it produces.
On 50 nodes and 1,000 containers that is about $815 a month.
You can skip the app, build your own Kubernetes dashboards and pay for telemetry only. Decide which before you estimate.
SigNoz Cloud
SigNoz is one application for metrics, traces and logs, built on OpenTelemetry and stored in ClickHouse.
- Entry: $49 a month, which includes $49 of usage (the pricing page shows $199 struck through next to it, so check it on the day you sign up)
- Logs and traces: $0.30 per GB, kept 15 days
- Metrics: $0.10 per million samples, kept 1 month
- No fee per user or per host
SigNoz publishes a guide for migrating from Datadog, and a tool that translates Datadog dashboard JSON into SigNoz dashboards as a starting point.
Grafana Cloud = more parts, more integrations, a bigger community. SigNoz = one product, one query screen, a simpler price list.
Route 4: Self-hosted open source
You run the stack in your own cluster. The licence costs nothing. The work is yours.
| Stack | Licence | What you run |
|---|---|---|
| Prometheus, Grafana, Loki, Tempo (Mimir when 1 Prometheus is too small) | Prometheus: Apache 2.0. Grafana, Loki, Tempo and Mimir: AGPLv3 | 4 or 5 systems, object storage, their upgrades |
| SigNoz community edition | MIT, outside its enterprise directories | SigNoz and a ClickHouse cluster |
| VictoriaMetrics for metrics, with Grafana on top | Apache 2.0 | A metrics store that speaks PromQL and also accepts Datadog Agent and DogStatsD metrics |
What you pay for on this route:
- Compute, disks and object storage for the telemetry
- Upgrades of every component
- Capacity planning when a team adds a label with 10,000 values
- An on-call rotation for the monitoring itself
Self-hosted cost = infrastructure + engineer time. The second number is the big one, and it is missing from every "free alternative" list.
My rule: self-host when the managed bill is larger than the engineer time it takes to run the stack, or when the data is not allowed to leave your account.
Under about 20 engineers, neither is usually true. I wrote about the stages in how to build a startup observability stack.
If you want the open source stack in your own account with someone else operating it, both vendors sell that too, at enterprise prices: Grafana Cloud has a Bring Your Own Cloud option on AWS and GCP (Enterprise starts at $25,000 a year), and SigNoz offers a BYOC plan on its Enterprise tier (from $4,000 a month).
Route 5: Your cloud's own monitoring
You already have it, and for a small system it is enough.
| Service | Logs | Metrics | Traces |
|---|---|---|---|
| Amazon CloudWatch (US East) | $0.50 per GB ingested, $0.03 per GB a month stored | Custom metrics: $0.30 each for the first 10,000, $0.10 for the next 240,000. OpenTelemetry metrics: $0.50 per GB ingested | Accepts OpenTelemetry data on its OTLP endpoints |
| Google Cloud Observability | $0.50 per GiB, first 50 GiB per project free, 30 days of storage included | Managed Service for Prometheus: $0.06 per million samples | $0.20 per million spans, first 2.5 million free |
The strength: no agent contract, no new vendor, access control you already manage.
The weakness: it stops at the edge of that cloud, and the classic per-metric price in CloudWatch punishes high cardinality harder than Datadog does. Metrics sent over OTLP are billed per GB instead.
A good use of this route is the mix: cloud monitoring for the managed services, an open source stack for your own applications.
500 GB of logs and 20,000 metrics, priced on each tool
Price lists are hard to compare because every unit is different. So here is 1 workload on each of them.
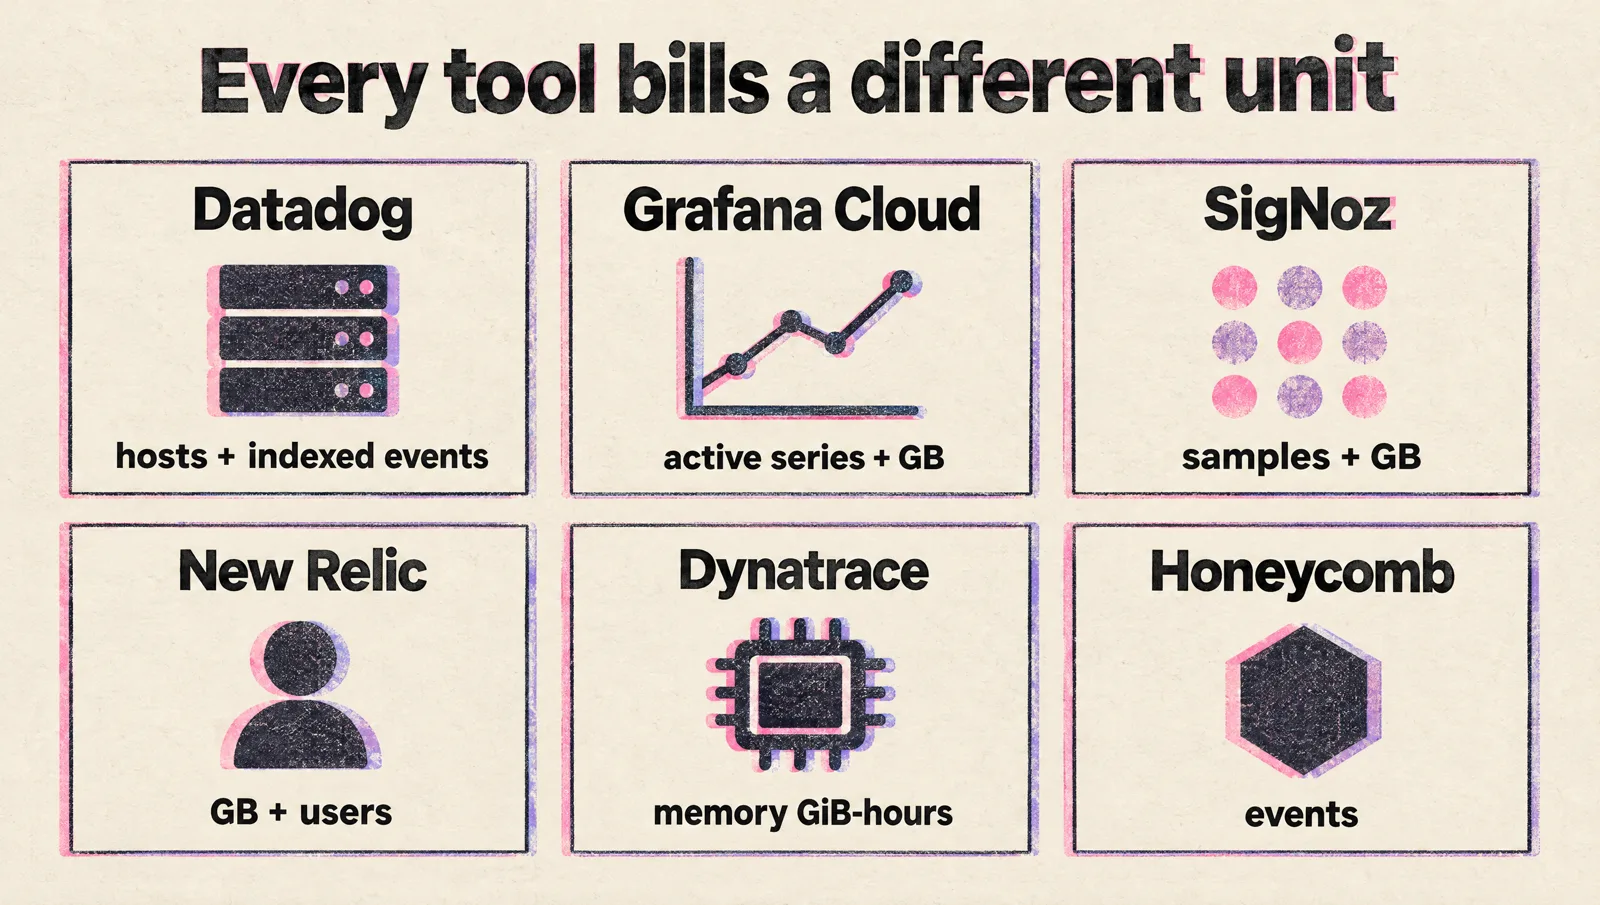
First, 500 GB of logs in a month (300 million events), all of it searchable:
| Tool | Calculation | Per month | Retention at that price |
|---|---|---|---|
| Datadog | 500 GB x $0.10 + 300 million events x $1.70 per million | $560 | 15 days |
| Grafana Cloud Pro | (500 - 50 included) x $0.55 | $247.50 | 30 days |
| SigNoz Cloud | 500 x $0.30 | $150 | 15 days |
| New Relic | 500 x $0.40 | $200 | 30 days |
| Dynatrace | 465.7 GiB x $0.20 | $93.13, plus retention per GiB-day and a charge per GiB scanned | You choose, 1 day to 10 years |
| Amazon CloudWatch | 500 x $0.50 | $250, plus $0.03 per GB a month stored and a charge per GB scanned by queries | You choose |
| Google Cloud Logging | (465.7 GiB - 50 free) x $0.50 | $207.83 | 30 days |
Dynatrace and Google bill per GiB, and 500 GB is 465.7 GiB.
New Relic's free 100 GB a month covers all your data together, so I left it out of the row. The Grafana Cloud prices are its "starts at" figures, without the $19 platform fee.
The Datadog row drops to $203 if exclusion filters leave 30% of the events indexed (Route 1). Compare the cleaned-up number, or the comparison flatters the alternative.
Second, 20,000 metric series, each reporting once a minute. That is 864 million samples in a 30 day month:
| Tool | Calculation | Per month |
|---|---|---|
| Datadog, as custom metrics on 50 Pro hosts | (20,000 - 5,000 included) / 100 x $5 | $750 |
| Grafana Cloud Pro | (20,000 - 10,000 included) / 1,000 x $6.50 | $65 |
| SigNoz Cloud | 864 million samples x $0.10 per million | $86.40 |
| Google Managed Service for Prometheus | 864 million samples x $0.06 per million | $51.84 |
| Amazon CloudWatch, classic custom metrics | 10,000 x $0.30 + 10,000 x $0.10 | $4,000 |
| Amazon CloudWatch, OpenTelemetry metrics | 864 million data points x 300 to 600 bytes = 259 to 518 GB, x $0.50 | $130 to $259 |
Read this table with one warning.
On Datadog, the metrics that come from its integrations are covered by the host price. Only your custom metrics are counted.
On a tool priced per series or per sample, EVERY series counts: the ones from your Kubernetes nodes, your pods and your databases too.
So count your real series before you celebrate. Run this in any Prometheus that scrapes your cluster:
count({__name__=~".+"})The number it returns is your active series count.
Then check your scrape interval. The table assumes 1 sample a minute. At a 15 second interval you send 4 times the samples: the per-sample rows are 4 times larger, and Grafana Cloud bills 4 data points a minute as 4 series.
On Grafana Cloud, add the Kubernetes Monitoring hours from Route 3 if you want that app.
The pattern across both tables: the open source based tools are cheaper per unit, and they count more units.
The switch costs more than the tool
A new observability tool is a migration project. These are the things that move:
| What you have in Datadog | What it becomes | Work |
|---|---|---|
| The Datadog Agent and its integrations | The OpenTelemetry Collector, or Prometheus exporters | Per integration |
| Tracing libraries (dd-trace) in every service | OpenTelemetry SDKs | Per service: the largest item |
| Custom metrics sent with DogStatsD | The same calls, received by a Collector or by a store that accepts the format | Small, with a test first: the Collector's statsd receiver is beta |
| Dashboards | Rebuilt, or translated where a tool exists | Per dashboard |
| Monitors | Alert rules in the new tool | Per monitor, with the thresholds checked again |
| Log pipelines, parsing rules and archives | Processors in the Collector, plus the new tool's own pipeline | Per pipeline |
| Links in runbooks, habits during incidents | New links, a practice session | Per team |
Do not rebuild every dashboard. Use the move to delete.
List the dashboards opened in the last 90 days and the monitors that paged someone. Migrate those. The rest was decoration.
If your monitors are a pile of noise today, moving them moves the noise. Fix that list first: how to handle alert fatigue.
Move to OpenTelemetry before you pick
OpenTelemetry is the open standard for producing and shipping telemetry. It became a Graduated project of the Cloud Native Computing Foundation (CNCF) in May 2026, and every tool on this page accepts it (VictoriaMetrics for metrics only).
Datadog accepts it too. That is the useful part.
You can change how telemetry leaves your services while Datadog stays your tool:
- Run the OpenTelemetry Collector in the cluster
- Point your services at the Collector
- Export from the Collector to Datadog's OTLP intake
- Add a second exporter when you want to try another tool
The relevant part of the Collector config then looks like this (trimmed from the setup Datadog documents, with a second destination added):
exporters:
  otlp_http/datadog:
    endpoint: https://otlp.${env:DD_SITE}
    headers:
      dd-api-key: ${env:DD_API_KEY}
  otlp_http/candidate:
    endpoint: ${env:CANDIDATE_OTLP_ENDPOINT}
    headers:
      authorization: ${env:CANDIDATE_OTLP_TOKEN}

service:
  pipelines:
    traces:
      receivers: [otlp]
      exporters: [otlp_http/datadog, otlp_http/candidate]
    logs:
      receivers: [otlp]
      exporters: [otlp_http/datadog, otlp_http/candidate]
The same spans and logs now reach both tools. Your services did not change.
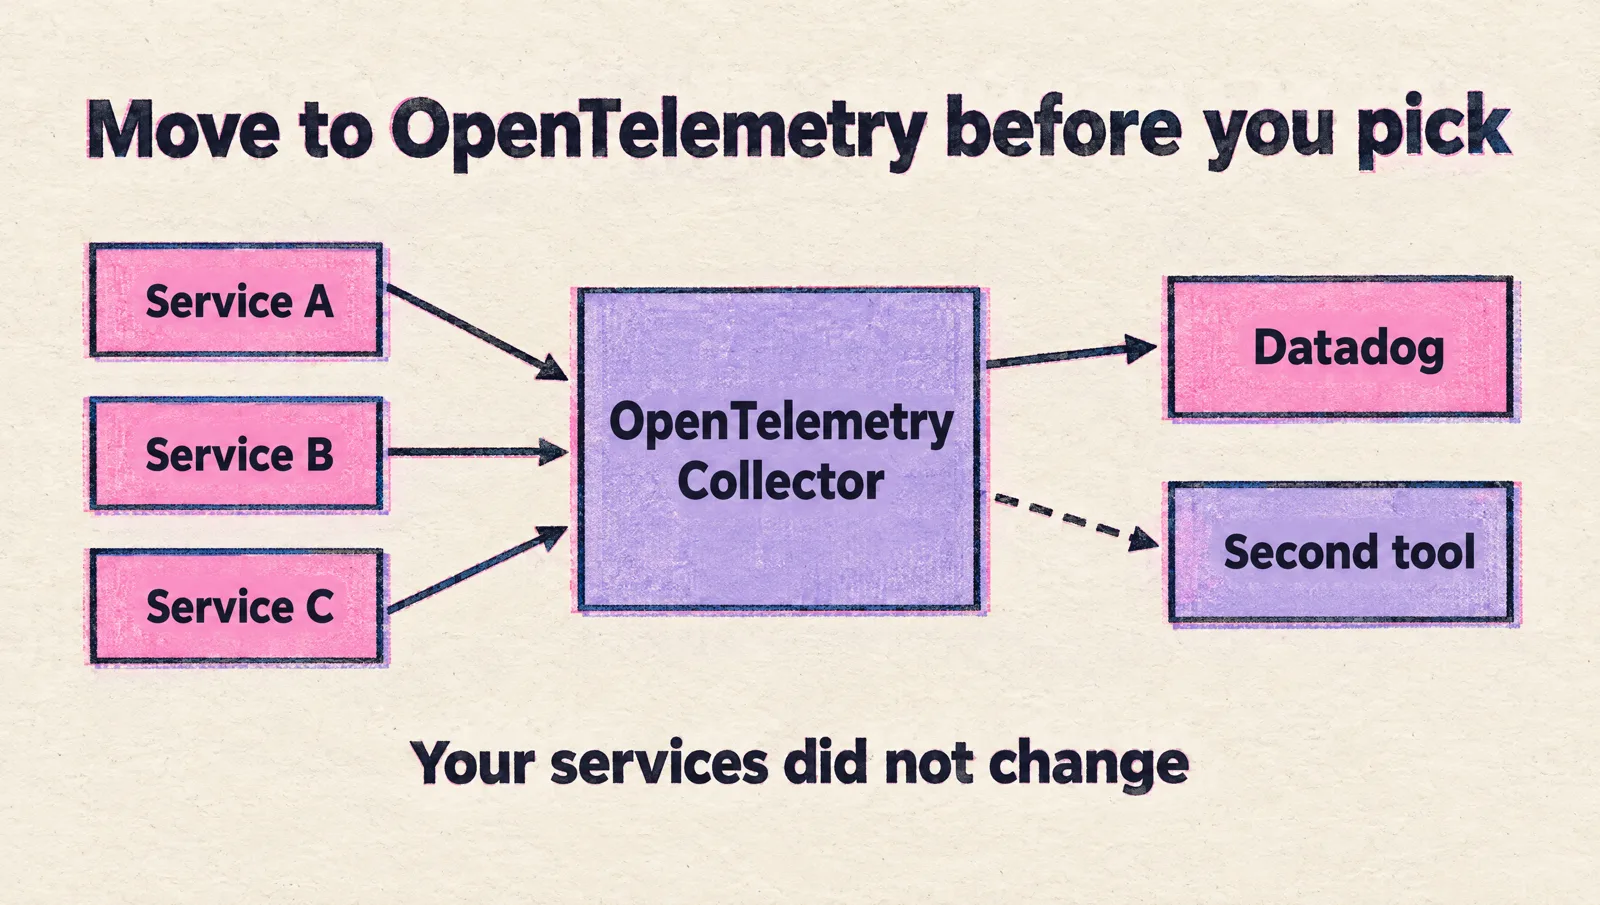
The header name for the second tool depends on the vendor. The exporter is named otlp_http since Collector v0.144.0 (older versions call it otlphttp), and Datadog's page asks for Collector Contrib v0.154.0 or later.
Datadog's full example adds processors, a metrics pipeline with a delta conversion, and a connector that produces the APM metrics. Start from their page and add the second exporter.
3 caveats, all from the docs:
- Metrics you send over OTLP count as Datadog custom metrics unless they come from a receiver Datadog supports. Move traces and logs first, and check the custom metrics line before you move metrics
- Some Datadog features expect Datadog's own libraries. Check Datadog's OpenTelemetry compatibility table for the ones you use
- If you cannot touch the services yet, the Collector has a Datadog receiver that accepts traffic from the Datadog Agent and tracing libraries. It is marked alpha, so treat it as a bridge for the migration
Lock-in = instrumentation in one vendor's format. OpenTelemetry removes it without removing the vendor.
Run both tools side by side, then cut over
The plan I would follow, in order:
- Clean up: apply Route 1, delete dead dashboards and monitors, write down the monthly volume per signal
- Shortlist 2 tools: price your real volume on each, in their units
- Dual-ship 1 service: add the second exporter for one team's services
- Rebuild the top 10: the 10 dashboards and the paging monitors for that team, in the new tool
- Run both for at least 2 weeks: include an on-call rotation and one real incident or a game day
- Decide with the on-call engineers: could they find the cause as fast as before?
- Roll out by team: then remove the Datadog exporter, the Agent and the contract lines, in that order
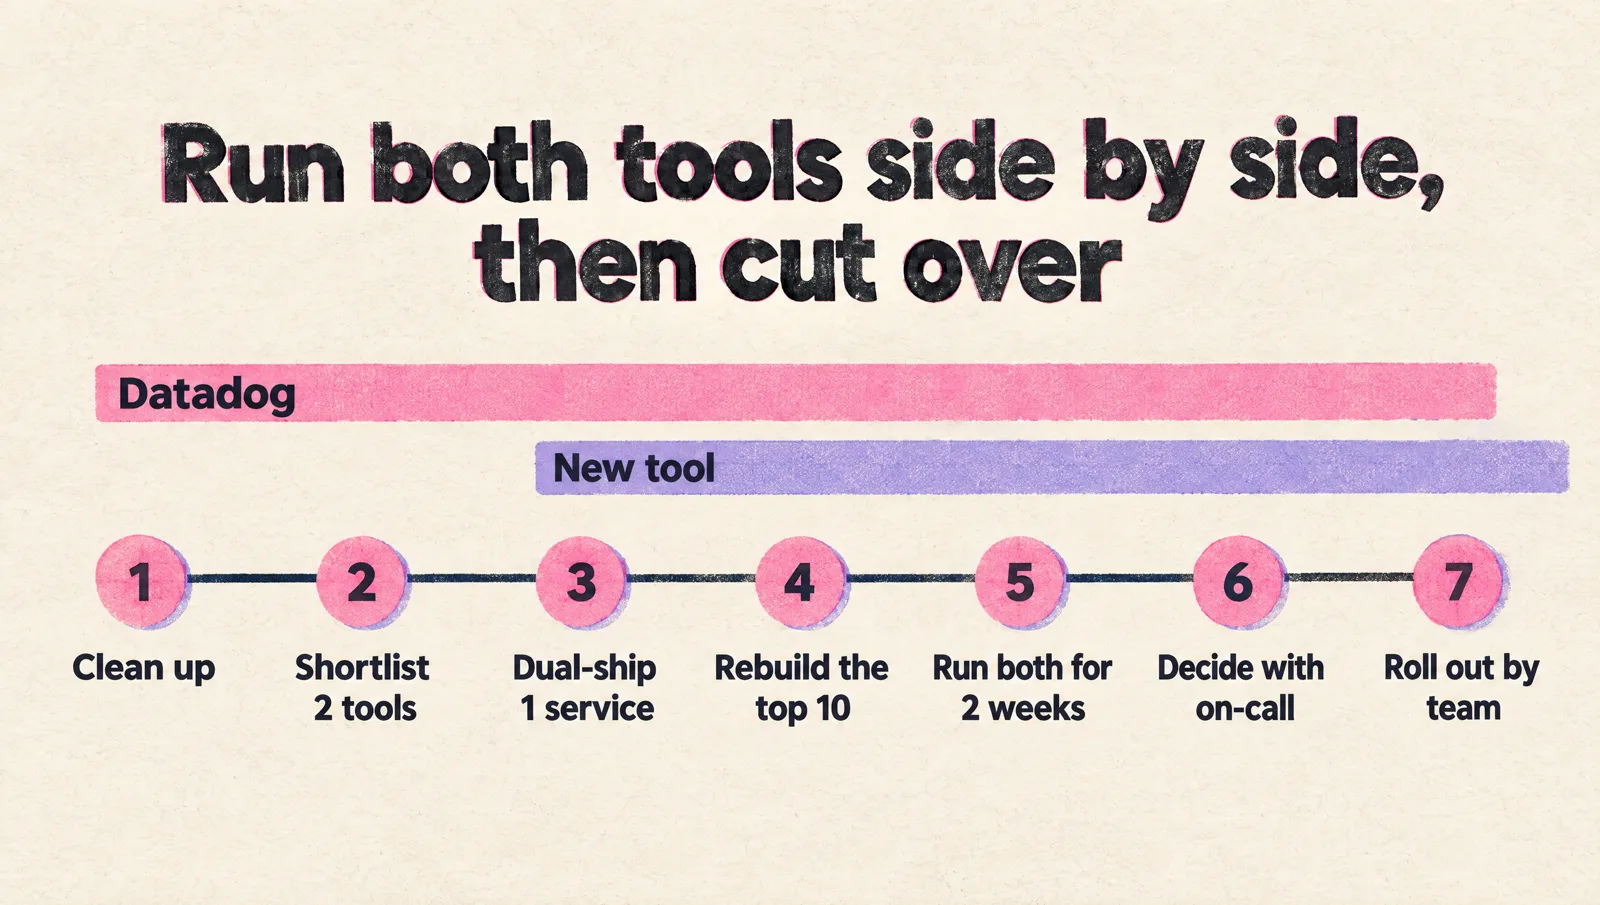
During the parallel run you pay twice for the services you dual-ship. Keep that set small and the period short.
Time the cut-over to your renewal date. A migration that ends a month after the renewal costs you a year of commitment.
Keep your SLO dashboards and their alerts for last, and move them only after the new numbers match the old ones.
Mistakes that make a migration expensive
- Comparing list prices in different units: hosts against GB against series. Price your own volume
- Comparing against the uncleaned Datadog bill: the alternative wins a contest it should have had to fight
- Forgetting the series you never paid for: integration metrics are included in a Datadog host and billed on a per-series tool
- Self-hosting with nobody assigned: the stack works until the first upgrade
- Migrating everything: every dashboard moved, a few of them opened
- Cutting over without a parallel run: you find the missing alert during the incident it was for
- Switching tool and instrumentation in the same month: change the instrumentation first, while the old tool still shows you what broke
The checklist
Always:
- Write down the products you use and the reason you want to leave
- Cut the Datadog bill before you compare
- Count your active series, your log GB and your trace GB for a month
- Price that volume on 2 tools, with retention and users included
- Ask every vendor for the minimum commitment and the overage price
- Send telemetry through an OpenTelemetry Collector before you choose
- Run both tools for at least 2 weeks
- Let the people on call make the final call
- Name the owner of the new stack, especially when it is self-hosted
FAQ
Who is Datadog's biggest competitor?
Among commercial platforms, Dynatrace and New Relic sell the closest thing: one product for metrics, traces and logs. Among open source options, the Grafana stack is the one most teams compare it with.
Is there a free alternative to Datadog?
Yes, at small scale. Grafana Cloud's free plan includes 10,000 metric series and 50 GB each of logs and traces, New Relic includes 100 GB a month and 1 full platform user, and Honeycomb includes 20 million events a month. Datadog has a free plan too: up to 5 hosts with 1 day of metric retention.
Is there an open source Datadog alternative?
Yes. The common ones are the Grafana stack (Prometheus, Loki, Tempo, Grafana) and SigNoz. Both can be self-hosted, and both are sold as a managed service by the company behind them.
Is Grafana better than Datadog?
Grafana is cheaper per unit and open source, and Datadog needs less setup. I would choose Grafana Cloud when cost and lock-in are the problem, and stay on Datadog when the team is small and the bill is under control.
Why is Datadog so expensive?
Because the bill follows usage that nobody approves: indexed log events, custom metric tag combinations, containers and APM hosts. The $15 host price is a small part of it. My pricing breakdown shows a 50 host bill where it is 17%.
Can I use OpenTelemetry with Datadog?
Yes. Datadog accepts OTLP through the Datadog Agent, through an OpenTelemetry Collector and on direct intake endpoints. Start with traces and logs: OTLP metrics can count as custom metrics on the Datadog bill.
How long does it take to move off Datadog?
The parallel run sets the minimum: 2 weeks. The rest depends on how many services still use Datadog's tracing libraries and how many dashboards and monitors you decide to keep.
A recap
If you take away 1 thing, let it be this:
Fix the bill first, standardize on OpenTelemetry second, and choose the tool third.
In that order, the choice is small and you can change it again.
You don't need a consultant for this. The steps are above, and the Datadog pricing breakdown has the filters and the numbers for the first one.
(Yes, I sell DevOps engineers.) If you would rather have a senior engineer go over the bill and the options with you, book a free 30-minute consultation.